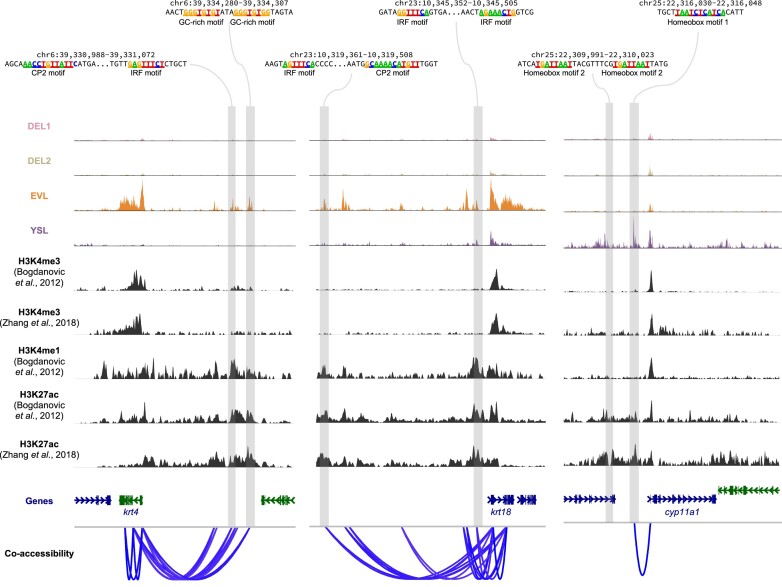
Figure 6.
Co-accessibility analysis links putative enhancers to their target genes. Examples of co-accessibility of peaks around EVL and YSL marker genes. The linkage strength analysed by Cicero was shown at the bottom. Cell-type specific open chromatin peaks with motifs from Figure 5C were highlighted. ChIP-seq data of H3K4me3, H3K4me3 and H3K27ac from two previous studies were also shown.

