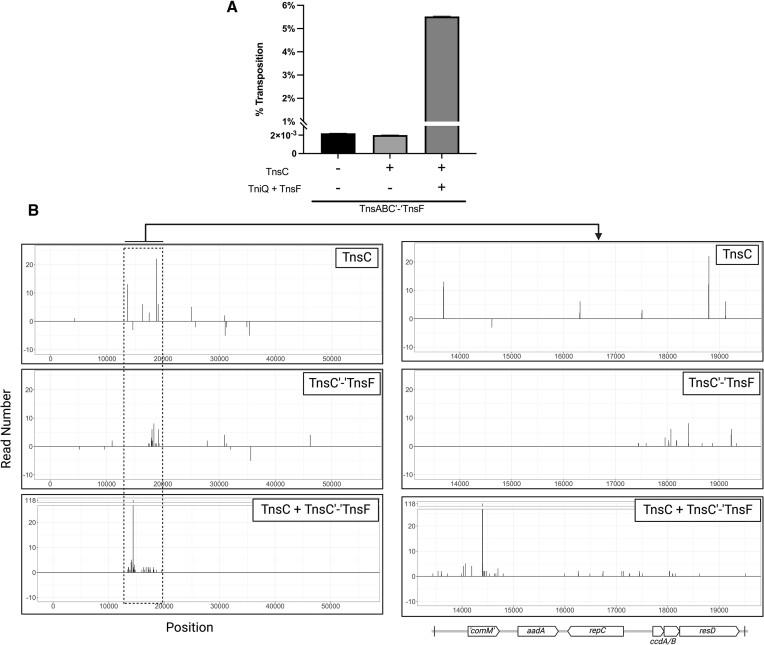
Figure 9.
TnsC’-‘TnsF fusion produces a dominant negative phenotype when co-expressed with full length TnsC. (A) Percent transposition as measured by the mating-out assay using strains expressing various combinations of Tn6022 transposition proteins. In all samples TnsA, TnsB and TnsC’-‘TnsF were all expressed in their native operon from a lactose inducible promoter. TnsC was separately cloned into a second expression vector under the control of a rhamnose inducible promoter. Experiments were performed in triplicate and error bars are reported as the standard error of the mean. (B) Illumina sequencing was done on total genomic DNA extracted from colonies isolated from mate-out assay recipient cells. Transposon left and right ends were identified and the number of reads that corresponded to each identified end were plotted on the x-axis, with bp position of F-‘comM’ plotted on the y-axis. Negative values represent reverse orientation insertions. All reactions were performed with 0.02% arabinose induction to express the full length TniQ + TnsF operon, 0.02% rhamnose to express the TnsC’-‘TnsF fusion, and 0.1mM IPTG to express the full length TnsABC operon. Created with BioRender.com.

