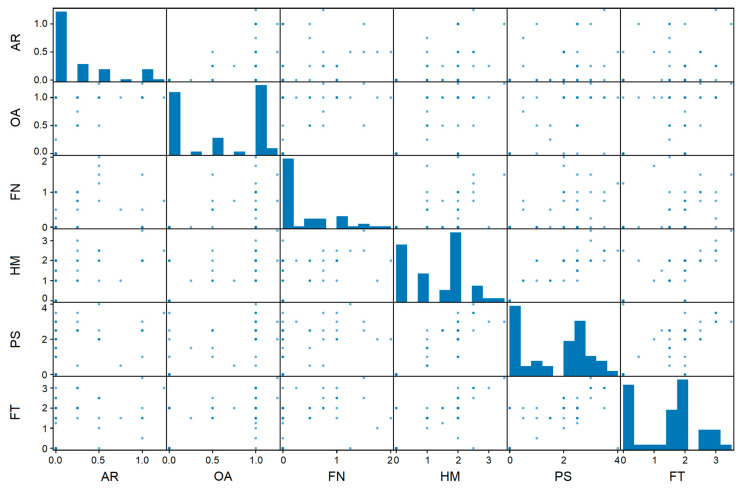
Figure 2.
Correlations between movement tasks and motor symptom ratings. To illustrate how patient ratings relate to different movements, the average rating was calculated separately for each patient and each movement, resulting in intermediate values in this scatter plot matrix. The plot visualises the variability in symptom expression, and patients may experience different levels of severity within each task, as reflected in the MDS-UPDRS III subitems.

