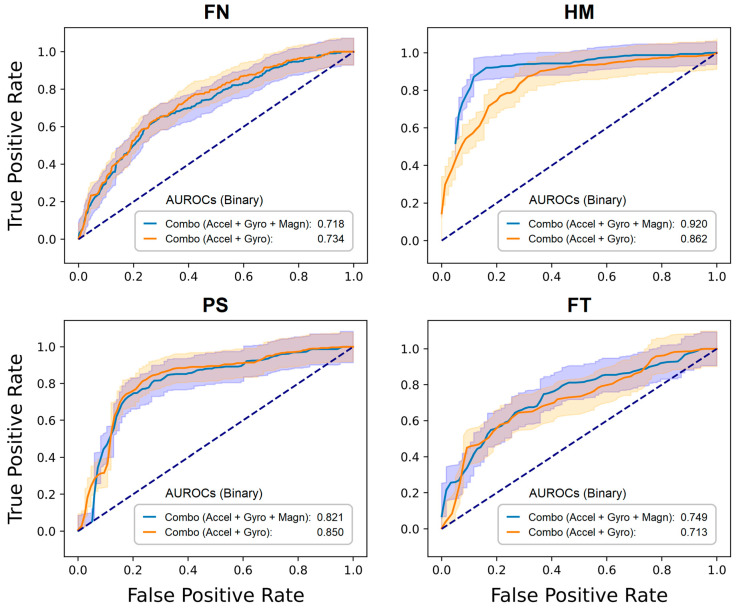
Figure 3.
ROC curves to distinguish between zero and non-zero motor scores. Random forest models were trained on the magnitude features derived from the data of the two sensor configurations commonly found in IMUs offered by manufacturers. The averaged area under the ROC (AUROC) values (with 95% CIs, shaded area) refer to Table 5.

