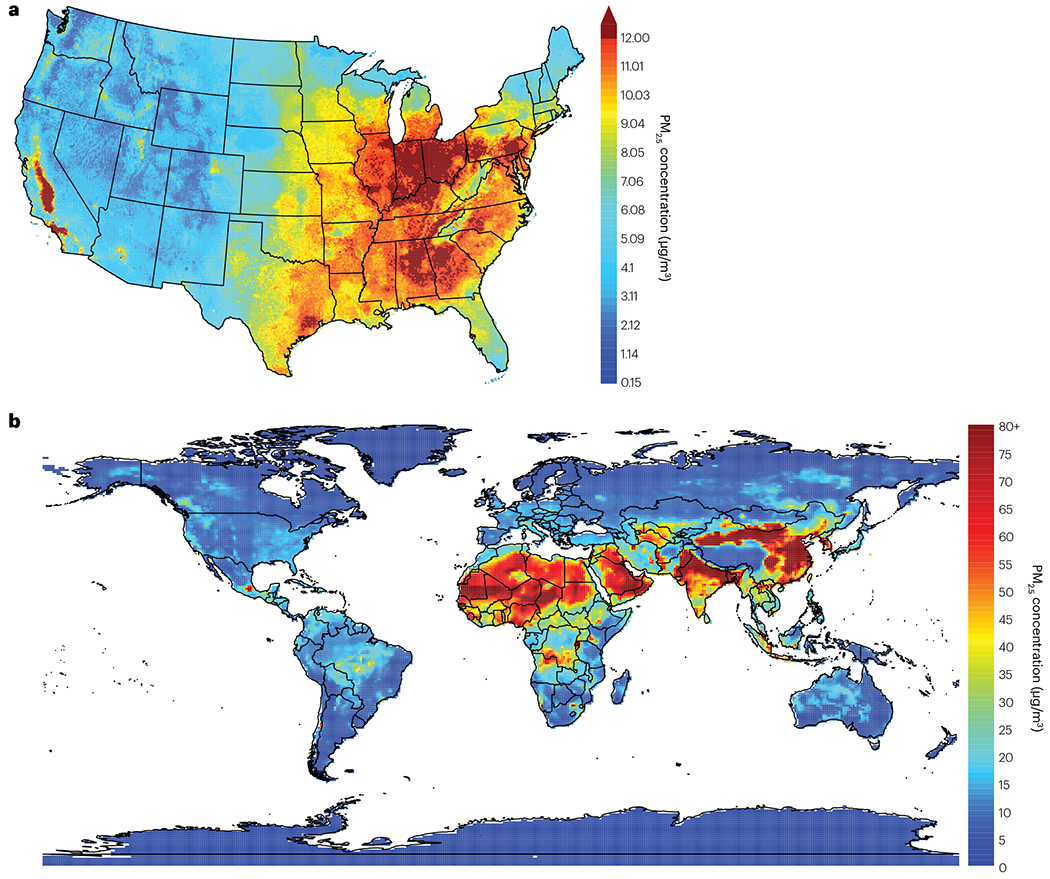
Fig. 3 |. Annual average PM2.5 concentrations across the world.

a, Mean annual average concentrations of particulate matter measuring ≤2.5 μm in diameter (PM2.5) across the contiguous United States, plotted in 1-km grids, spanning years 2000–2016 (ref. 276). The annual estimates are averages of daily predictions for each year in each grid cell. The current US Environmental Protection Agency annual average primary, health-based national ambient air quality standard for PM2.5 is ≤12.0 μg/m3, with a proposed revision to within 9.0–10.0 μg/m3 announced in January 2023 (ref. 275). b, Mean annual average PM2.5 concentrations across the globe, spanning years 2003–2022, according to European Centre for Medium-range Weather Forecasts Atmospheric Composition Reanalysis 4. Performed by the Copernicus Atmosphere Monitoring Service, the reanalysis combines data from modelling studies with observations from across the world into a globally complete dataset277. Annual estimates are averages of monthly predictions. The WHO air quality guidelines273 recommend annual mean PM2.5 concentrations of ≤5 μg/m3.
