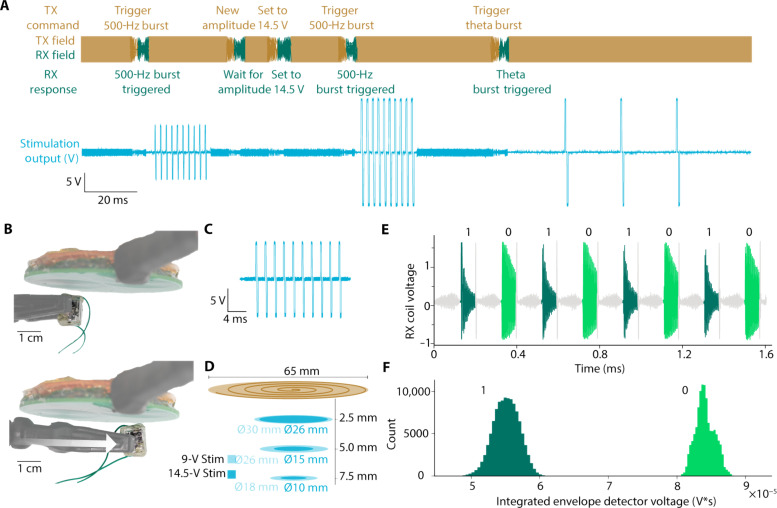
Fig. 3. Characterization results for DOT WPT and communication.
(A) Example experimental sequence of the transceiver field and implant stimulation outputs. The transmitter field (orange) provides power during the charging phases, followed by programming phases where digital downlink data (dark orange) are transmitted to the device and uplink data (green) are returned. Here, the device was programmed to have different output voltages, stimulate with 10-pulse 500-Hz pulse trains, and stimulate with 3-pulse 50-Hz pulse trains. The output voltage generated by the stimulator (blue) shows the different patterns of stimulation generated based on the transmitted instructions. (B) Experimental images showing two positions where the device is able to output biphasic 9-V, 10-pulse, 500-Hz pulse trains across a 1-kilohm resistor with a field strength of 7 mT at the coil surface and the corresponding simulation output. (C) Example biphasic 9-V, 10-pulse, 500-Hz pulse train from the device. (D) Plot showing experimentally determined locations the device is able to output biphasic 9- or 14.5-V, 10-pulse, 500-Hz pulse trains across a 1-kilohm resistor at different distances from the transceiver coils with a field strength of 7 mT at the coil surface. (E) A sequence of 1 and 0 bits used to calibrate the threshold for differentiating the two bits. This calibration sequence is used on demand to account for changes in implant positioning relative to the transceiver. (F) A histogram showing the integrated voltage of the ringdown signal for bits 1 and 0 with 223,888 sampled bits with the implant at a distance of 1 cm from the transceiver coils. Bits 1 and 0 are very well separated and easy to differentiate from the receiver.

