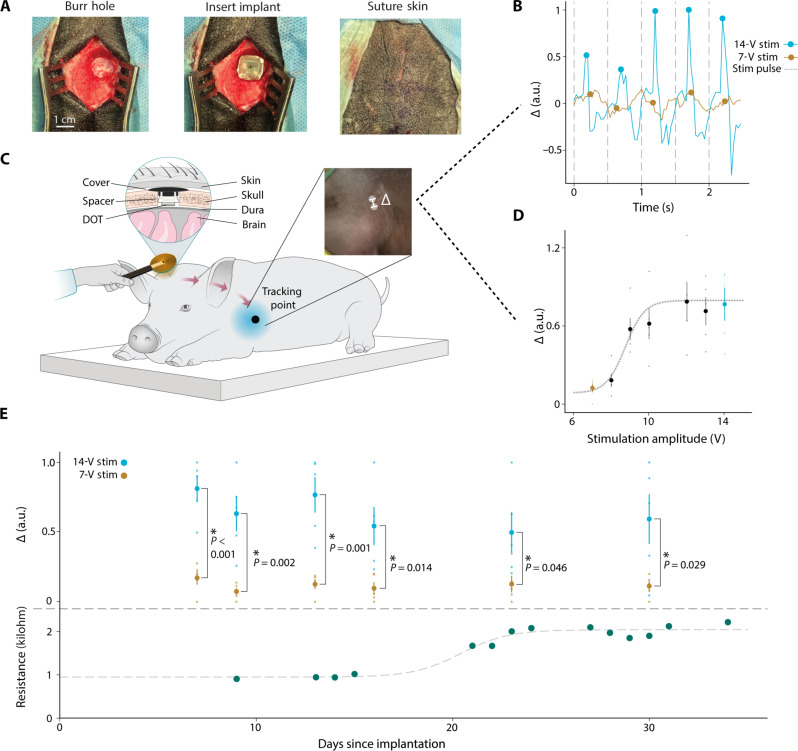
Fig. 5. Thirty days of epidural cortical stimulation in a large animal model.
(A) Surgical photos of the DOT implantation procedure. (B) Forelimb movement in response to stimulation extracted from experimental videos using DeepLabCut. The peaks of the movement in the 350 ms following stimulation at 7-V stimulation amplitude (yellow) and 14-V stimulation amplitude (blue) are marked with circles. (C) Schematic of device testing during chronic implantation in a porcine model. The schematic is reflected for visualization. Left inset: A cross section of the DOT implant above the dura and below the skin of the pig. Right inset: An example frame from the video used to quantify forelimb movement. (D) Mean of five movement peaks extracted from a video with increasing stimulation amplitude from 7 to 14 V, and error bars represent SE. Dotted line shows a sigmoidal fit with an approximate motor threshold at 10 V. The 7-V (yellow dot) response is well below the motor threshold which we use as the noise floor, and the 14-V (blue dot) response shows much higher displacement, indicative of movement in response to stimulation. (E) Top: Mean of the movement peak amplitudes extracted from videos over the entire implantation period (blue dots). Average movement amplitude of 5 pulses of 14-V stimulation (orange dots), average movement amplitude of five samples at 7-V stimulation. Error bars represent SE. On all days tested, we see significantly more motor evoked response from 14-V stimulation compared to 7-V stimulation (independent samples t test, P < 0.05). Bottom: Resistance as measured with ME backscatter communication over the entire implantation period. An increase from ~1 to ~2.25 kilohm was seen between days 15 and 25 but leveled off following day 25. Dotted line shows a sigmoidal fit.

