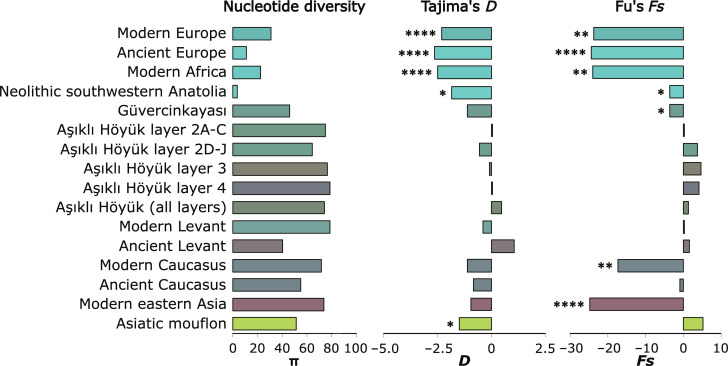
Fig. 3. Population genetics statistics.
Estimations of nucleotide diversity, Tajima’s D, and Fu’s Fs. The asterisks show the significance level of the associated statistical test on the statistics (* = 0.01 to 0.05, ** = 0.001 to 0.01, *** = 0.0001 to 0.001, and **** = 0.00001 to 0.0001). Significant values of Tajima’s and Fu’s neutrality tests could indicate past demographic bottlenecks. The bars’ colors correspond to the sample frequency-weighted average of the haplogroup’s colors shown in Figs. 1 and 2. These statistics suggest a bottleneck in the ancestry line of the European populations and possibly Neolithic southwestern Anatolia, while the colors reflect the haplogroup differences between eastern and western samples (notice the gray tones of Aşıklı Höyük samples).

