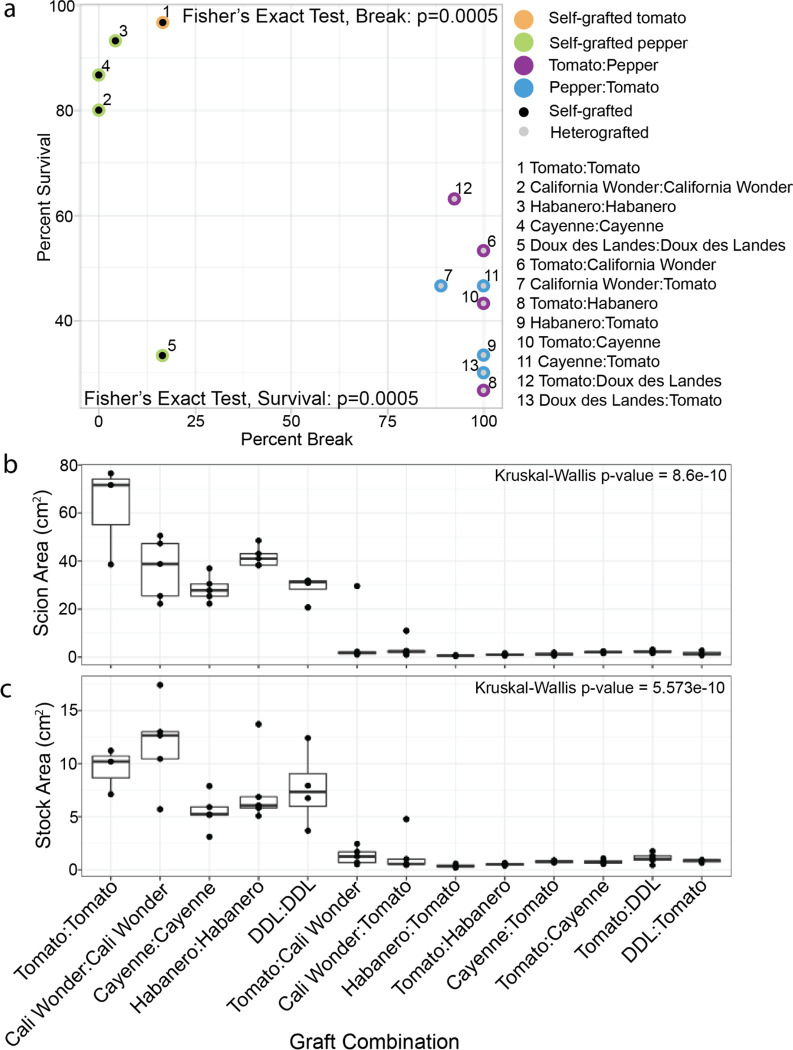
Figure 1: Heterografted tomato and pepper combinations exhibit moderate survival, unstable stem integrity, and reduced growth.
The relationship between percent survival (y-axis) and percent break (x-axis) is shown for all graft combinations (a). Black dots denote self-grafts, grey dots denote heterografts. Self-grafted tomato is outlined in orange. Self-grafted pepper is outlined in green. Heterografts where the scion is tomato are outlined in purple. Heterografts where the stock is tomato are outlined in blue. The identity of each data point is labeled 1–13. Percent survival n=30; For bend test sample size see Table S1. The change in stem diameter 2cm above the graft junction between 30 and 0 DAG (scion) (b). The change in stem diameter 2 cm below the graft junction between 30 and 0 DAG (stock) (c). California Wonder abbreviated to Cali Wonder, Doux des Landes abbreviated to DDL. Biological replicates are depicted as jitter and described in Table S2. Kruskal–Wallis one-way analysis of variance was used to detect significant differences between self-and heterografted combinations. p-value <0.05.

