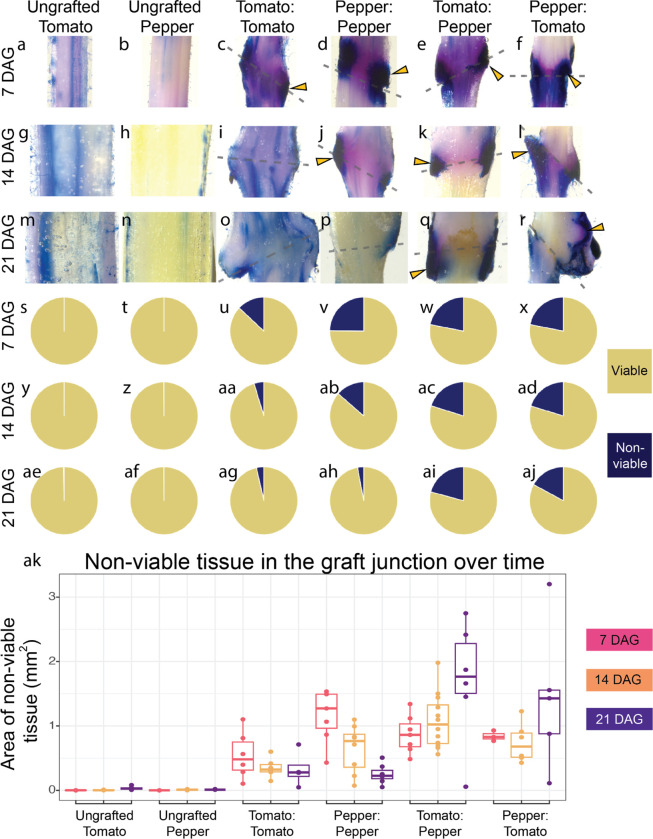
Figure 3: Incompatible grafts contain persistent nonviable tissue over time.
(a-r) Representative images of 2.5 mm long graft junctions at 7, 14, and 21 DAG stained with Trypan Blue. A representative ungrafted tomato stem and the percent of non-viable tissue (NVT) are shown at 7 DAG (a, s), 14 DAG (g, y), and 21 DAG (m, ae). A representative ungrafted pepper stem and the percent of NVT at 7 DAG (b, t), 14 DAG (h, z), and 21 DAG (n, af). A representative self-graft tomato junction and the percent of NVT at 7 DAG (c, u), 14 DAG (i, aa), and 21 DAG (o, ag). A representative self-grafted pepper junction and the percent of NVT at 7 DAG (d, v), 14 DAG (j, ab), and 21 DAG (p, ah). A representative tomato:pepper junction and the percent of NVT at 7 DAG (e, w), 14 DAG (k, ac), and 21 DAG (q, aI). A representative pepper:tomato junction and the percent of NVT at 7 DAG (f, x), 14 DAG (l, ad), and 21 DAG (r, aj). Yellow arrows point to examples of deep tissue death; dashed lines signify the graft site; all junctions are 2.5 mm tall (a-r). (s-aj) The percent of cell death and (ak) the area of cell death in the junction of all graft combinations at 7, 14, and 21 DAG. Pink boxplots are 7 DAG, orange boxplots are 14 DAG, and purple boxplots are 21 DAG. Biological replicates are depicted as jitter (ak) as well as described in detail in Table S4.

