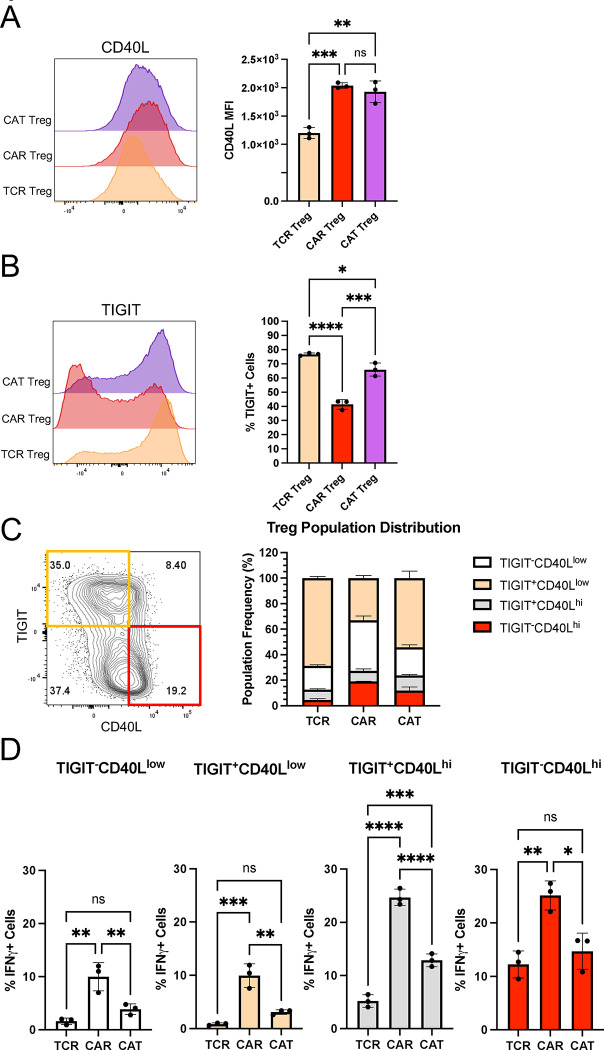
Figure 10. CD40L expression is associated with IFNγ production in CAR Tregs.
(A) CD40L surface expression in TCR Tregs, CAR Tregs, and CAT Tregs 18h post-activation. Representative histograms on the left and summary data on the right. (B) TIGIT surface expression in TCR Tregs, CAR Tregs, and CAT Tregs 18h post-activation. Representative histograms on the left and summary data on the right. (C) Relative frequency of TIGIT−CD40Llow, TIGIT+CD40Llow, TIGIT−CD40Lhi, and TIGIT+CD4Lhi cells among TCR Tregs, CAR Tregs, and CAT Tregs 18h post-activation. (D) Frequency of IFNG producing cells among TIGIT−CD40Llow, TIGIT+CD40Llow, TIGIT−CD40Lhi, and TIGIT+CD4Lhi subpopulations for TCR Tregs, CAR Tregs, and CAT Tregs 18h post-activation. For Figures 10A, B, and D, values represent technical replicates of representative experiments. Bars represent mean ± SD. One-way ANOVA test with Tukey’s multiple comparison correction. ****, p < 0.0001; ***, p < 0.001; **, p < 0.01; *, p < 0.05; ns, not significant.

