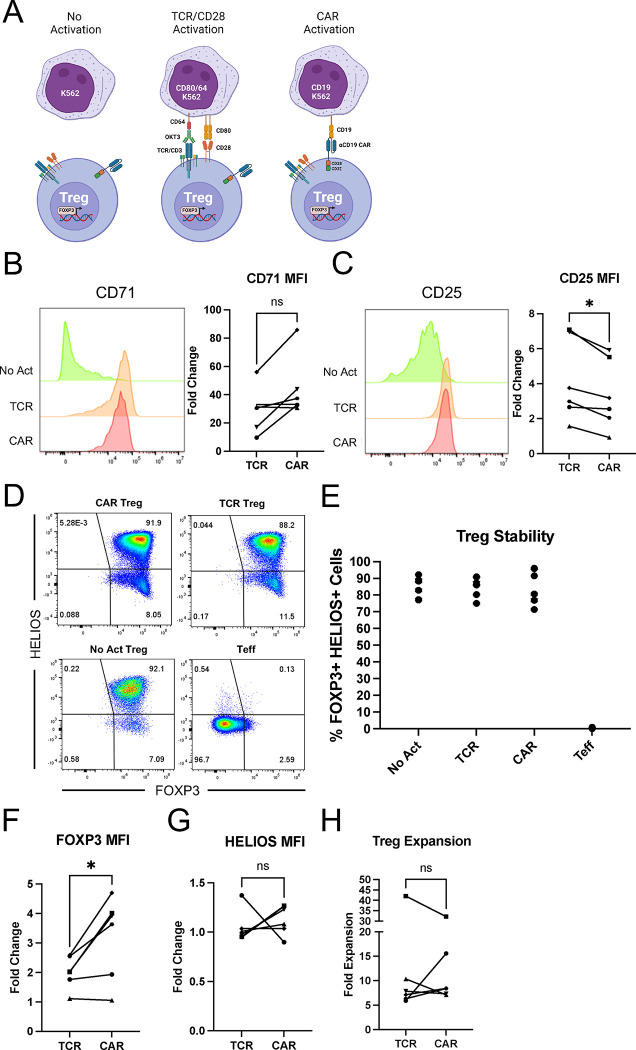
Figure 2. CAR and TCR/CD28 activation result in phenotypically similar Tregs.
(A) Schematic with the three modes of activation used in this study: No Activation with target K562 cells (No Act), TCR/CD28 activation with target K562 cells expressing CD64 loaded with anti-CD3 antibody and CD80 (TCR), and CAR activation with target K562 cells expressing CD19 (CAR). (B) CD71 surface expression 48h after Treg activation. Representative histogram on the left and summary data across donors of fold change in CD71 mean fluorescence intensity (MFI) in relation to No Act Tregs on the right. (C) CD25 surface expression 48h after Treg activation. Representative histogram on the left and summary data across donors of fold change in CD25 MFI in relation to No Act Tregs on the right. (D) Representative dot plots of FOXP3 and HELIOS expression in CAR Treg, TCR Treg, and No Act Treg, as well as in Teff cells as a negative staining control. (E) Percentage of FOXP3+HELIOS+ cells across activation modes and donors. (F) Fold change in FOXP3 MFI in TCR Tregs or CAR Tregs over No Act Tregs across donors. (G) Fold change in HELIOS MFI in TCR Tregs or CAR Tregs over No Act Tregs across donors. (H) Fold expansion in cell number for TCR Tregs and CAR Tregs one-week post-activation. For Figures 2B, 2C, 2F, 2G, and 2H, values represent mean ± SD of technical triplicates per blood donor, with lines collecting the data points from the same donor. Unpaired Student’s t test. *, p < 0.05; ns, not significant.

