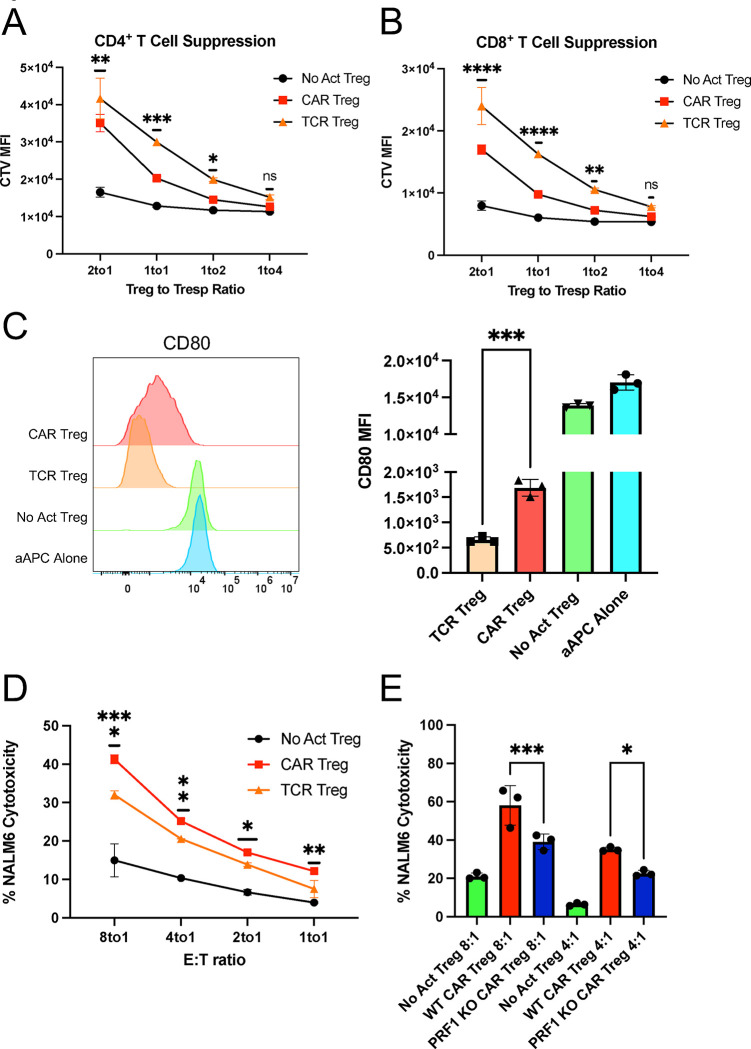
Figure 3. CAR activation leads to a shift from suppression to cytotoxicity in Tregs.
(A) Inhibition of CellTrace Violet (CTV) labeled CD4+ T responder cell (Tresp) proliferation by Tregs. (B) Inhibition of CTV labeled CD8+ Tresp proliferation by Tregs. (C) Downregulation of CD80 surface expression in CD80-NALM6 cells (aAPC – artificial antigen presenting cells) by Tregs. Representative histograms on the left and summary data on the right. (D) Treg cytotoxicity towards target NALM6 cells at different effector to target (E:T) ratios. (E) WT and PRF1 KO CAR Treg cytotoxicity towards target NALM6 cells at different E:T ratios. Values represent technical replicates of representative experiments. Bars represent mean ± SD. One-way ANOVA test with Tukey’s multiple comparison correction. ****, p < 0.0001; ***, p < 0.001; **, p < 0.01; *, p < 0.05; ns, not significant.

