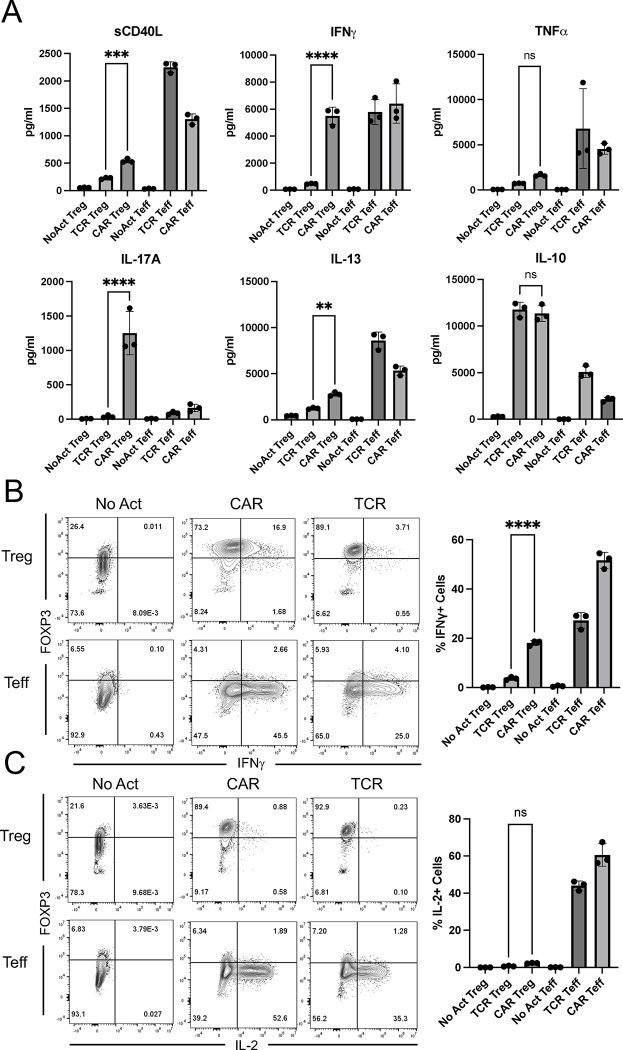
Figure 5. CAR Tregs uniquely produce inflammatory cytokines.
(A) Levels of cytokines secreted into the supernatant by No Act Tregs, TCR Tregs, CAR Tregs, No Act Teff, TCR Teff, and CAR Teff 48h post-activation. (B) Intracellular levels of IFNG produced by No Act Tregs, TCR Tregs, CAR Tregs, No Act Teff, TCR Teff, and CAR Teff 18h post-activation. Representative countour plots on the left and summary data on the right. (C) Intracellular levels of IL-2 produced by No Act Tregs, TCR Tregs, CAR Tregs, No Act Teff, TCR Teff, and CAR Teff 18h post-activation. Representative contour plots on the left and summary data on the right. Values represent technical replicates of representative experiments. Bars represent mean ± SD. One-way ANOVA test with Tukey’s multiple comparison correction. ****, p < 0.0001; ***, p < 0.001; **, p < 0.01; *, p < 0.05; ns, not significant.

