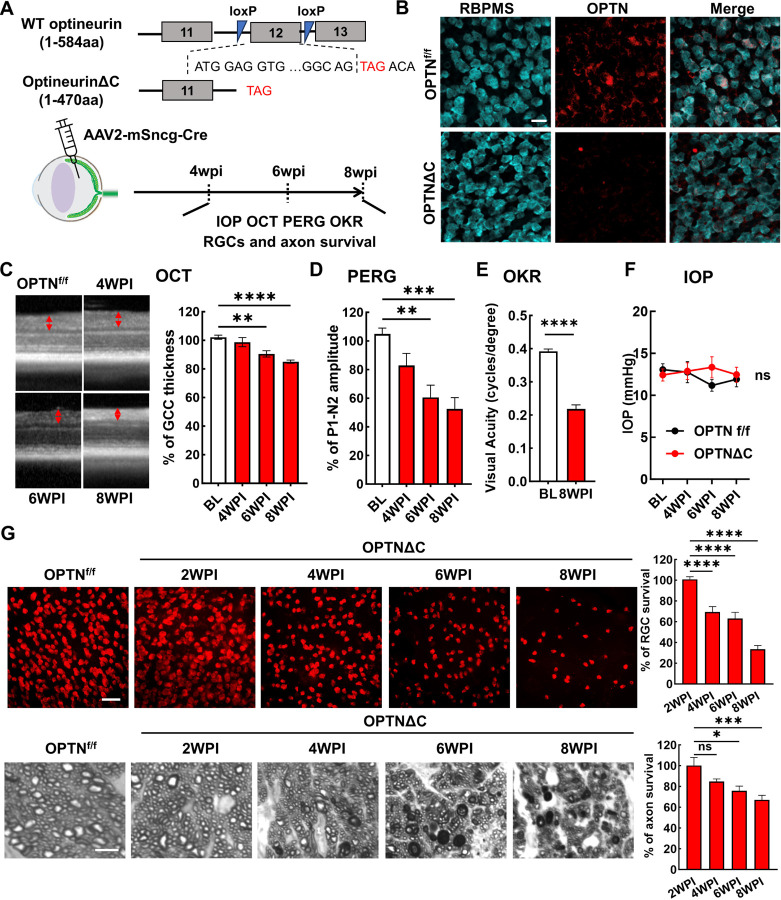
Figure 1. RGC-specific OPTN C-terminus truncation leads to progressive RGC and ON degeneration.
A, Exon 12 of the endogenous OPTN gene is flanked by loxP sites in the OPTNf/f mouse line; excision by Cre produces a C-terminus truncated OPTN protein (OPTNΔC). AAV2-mSncg-Cre was intravitreally injected to truncate OPTN specifically in RGCs. In vivo measurements of OCT, PERG, OKR, and IOP and histological quantification of surviving RGC somata and axons were performed at 4–8 weeks post injection (4-8wpi). B, Representative images of retinal wholemounts labeled with RGC marker RBPMS and C-terminus OPTN antibodies. Scale bar, 20 μm. C, Representative in vivo OCT images of mouse retinas at baseline before AAV-Cre injection, and at 4-8wpi. GCC: ganglion cell complex, including RNFL, GCL and IPL layers; indicated as double end arrows. Quantification is represented as percentage of GCC thickness in the OPTNΔC eyes compared to the contralateral control (CL) eyes. n = 10–12 mice. D, Quantification of P1-N2 amplitude of PERG at different time points, represented as a percentage of OPTNΔC eyes compared to the CL eyes. n = 7–14 mice. E, Visual acuity of OPTNΔC eyes and CL eyes measured by OKR at 8wpi. n = 7 mice. F, IOP of OPTNΔC eyes and CL eyes. n = 11 mice. G, Upper panel, representative confocal images of retinal wholemounts showing surviving RBPMS-positive RGCs at different time points, Scale bar, 50 µm. Lower panel, light microscope images of semi-thin transverse sections of ON with PPD staining at different time points. Scale bar, 5 µm. Quantification of surviving RGC somata in peripheral retinas and surviving axons in ONs, represented as percentage of OPTNΔC eyes compared to the CL eyes. n = 5–12 mice. All the quantification data are presented as means ± s.e.m, *: p<0.05, **: p<0.01, ***: p<0.001, ****: p<0.0001, ns: no significance. C, D, G with one-way ANOVA with Dunnett’s multiple comparisons test; E with paired Student’s t-test; F with two-way ANOVA.

