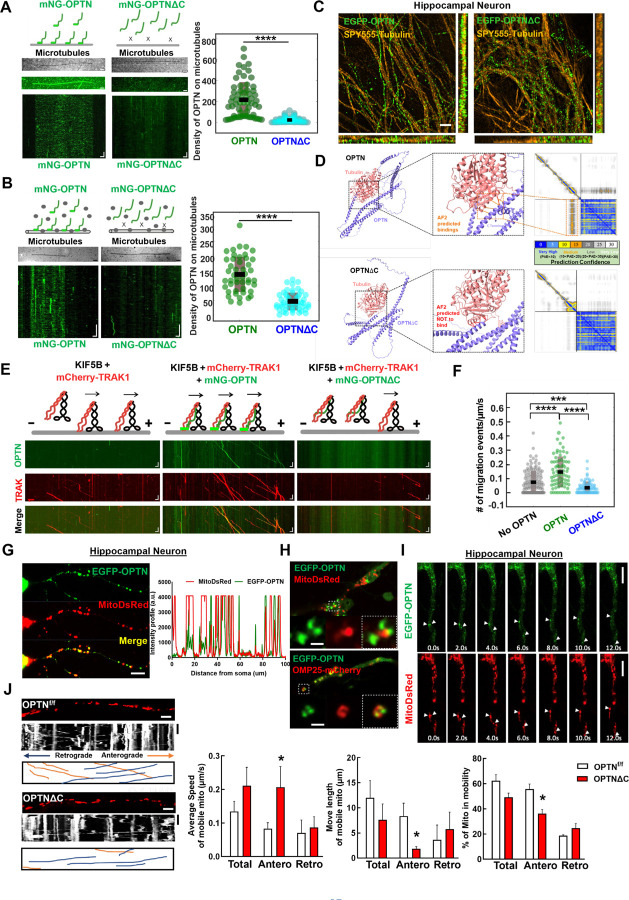
Figure 4. OPTN tethers KIF5B-TRAK1 complex to microtubules in a C-terminus dependent manner for adequate axonal mitochondria delivery.
A, In vitro reconstitution assay: OPTN on immobilized microtubules. Left (top to bottom): Schematic representing interaction of OPTN/OPTNΔC with microtubules, IRM image of microtubules, maximum intensity projection, and kymograph of 20 nM mNG-OPTN or 0.1 µM mNG-OPTNΔC. Horizontal scale bar = 2.1 μm, vertical scale bar, 4 seconds. Right, quantification of density of OPTN/OPTNΔC on microtubules. n = 3 experiments. ****: p <0.0001, t-test. B, Lysates of mNG-OPTN or mNG-OPTNΔC overexpressing cells on immobilized microtubules. Left (top to bottom): Schematic representing interaction of cell lysates expressing OPTN/OPTNΔC with microtubules, IRM image of microtubules, and kymograph of mNG-OPTN or mNG-OPTNΔC. Horizontal scale bar, 2.0 μm, Vertical scale bar, 10 seconds. n = 3 experiments. Right, quantification of density of OPTN/OPTNΔC on microtubules. n = 3 experiments, ****: p <0.0001, t-test. C, SIM super-resolution images of cultured mouse E15 hippocampus neuron transfected with EGFP-OPTN or EGFP-OPTN∆C, and stained for microtubules with SPY555-tubulin. Scale bars, 2 μm. D, The AlphaFold2 predicated interaction between OPTN or OPTN∆C and Tubulin alpha-1A. The prediction confidence is visualized as heatmap of Predicted Aligned Error (PAE) plots. The x-axis and y-axis of the plot represent the sequence of amino acids in the two proteins. Each dot is color-coded in PAE in the grid, corresponding to the pair of amino acids in both proteins. E, In vitro reconstitution motility assay of immobilized microtubules. (top to bottom) Schematic representation of KIF5B-TRAK1 transportation complex with or without OPTN or OPTNΔC on microtubules, kymograph of mNG-OPTN or mNG-OPTNΔC and mCherry-TRAK1 walking to plus end of microtubules in the presence of unlabeled KIF5B. Horizontal scale bar, 2 μm; vertical scale bar, 10 seconds. F, Frequency of migration events (/μm/s) of complexes of KIF5B-TRAK1 (n = 133), KIF5B-TRAK1-OPTN (n = 73), KIF5B-TRAK1-OPTNΔC (n = 71), n = 3 experiments. ****: p < 10-7, ***: p =0.0002, t-test. G, Representative confocal images of cultured hippocampal neuron axons co-transfected with meGFP-OPTN with MitoDsRed to show the colocalization of OPTN and mitochondria in axons. The intensity profile analysis is shown in the right panel. Scale bar, 20 μm. H, Representative confocal images of cultured hippocampal neuron axons co-transfected with meGFP-OPTN with MitoDsRed or OMP25-mCherry. Higher magnification images of mitochondria are shown in the right lower panels. Scale bar, 5 μm. I, Time-lapse images of cultured hippocampal neuron axons co-transfected with meGFP-OPTN with MitoDsRed. White arrow heads indicate the colocalized meGFP-OPTN and mitochondria that are moving together in axons. Scale bar, 20 μm. J, Mitochondrial movement (anterograde movement: orange, retrograde movement: blue) in OPTNf/f or OPTNΔC hippocampal neuron axons transfected with MitoDsRed. The first frame (time = 0s) of live imaging series is shown with the kymograph. Quantifications of average speed of mobile mitochondria, move length of mobile mitochondria and percentage of mitochondria in mobility are shown to the right. n = 12–15 mitochondria from 3 axons per group. Horizontal scale bar, 10 μm, Vertical sale bar, 1 minute. Quantification data are presented as means ± s.e.m, *: p<0.05 with t-test.

