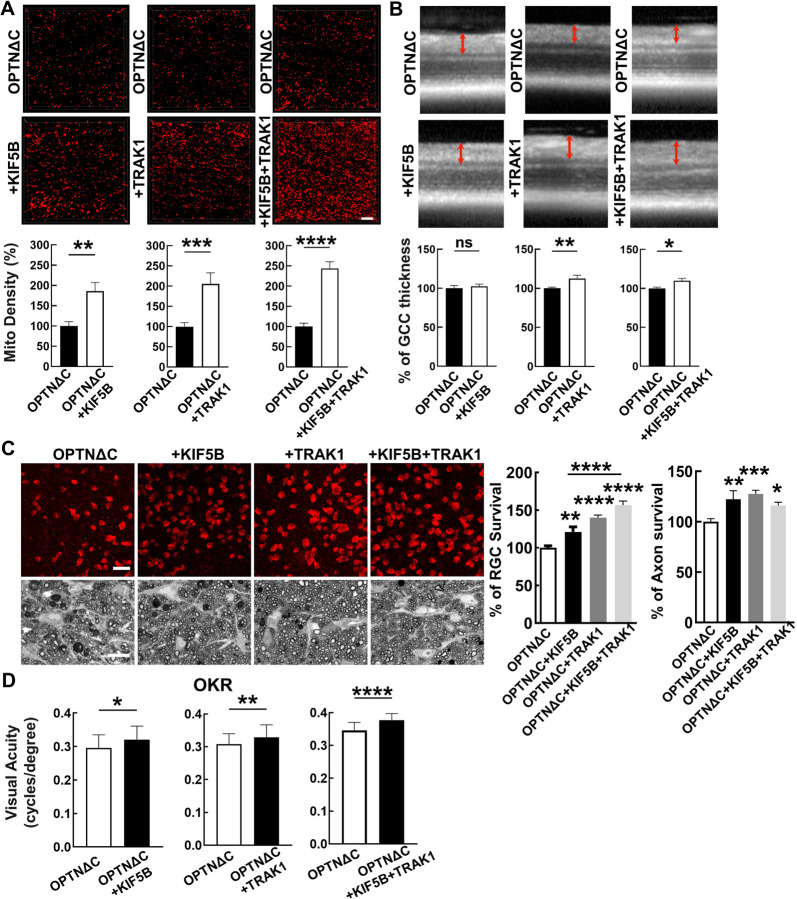
Figure 5. Overexpression of KIF5B and/or TRAK1 rescues the axonal mitochondria deficit and neurodegeneration induced by OPTNΔC.
A, Representative images of MitoTracker-labeled ON longitudinal sections. Scale bar, 10 μm. Quantification of Mito Density, represented as a percentage of treated OPTNΔC eyes compared to the CL non-treated OPTNΔC eyes 2 weeks after intravitreal injection of AAV-Cre. n = 4–5 mice. Data are presented as means ± s.e.m, **: p<0.01, ***: p<0.001, ****: p<0.0001, paired Student’s t-test. B, Representative in vivo OCT images of mouse retinas at 8wpi. Quantification is represented as percentage of GCC thickness in the treated OPTNΔC eyes compared to the CL non-treated OPTNΔC eyes. n = 7–10 mice. Data are presented as means ± s.e.m, ns, no significance; *: p<0.05, **: p<0.01, paired Student’s t-test. C, Upper panel, representative confocal images of retinal wholemounts showing surviving RBPMS-positive RGCs at 8wpi. Scale bar, 20 µm. Lower panel, light microscope images of semi-thin transverse sections of ON with PPD staining at 8wpi. Scale bar, 10 µm. Quantification of surviving RGC somata in peripheral retinas and surviving axons in ONs, represented as percentage of treated OPTNΔC eyes compared to the CL non-treated OPTNΔC eyes. n = 8–12 mice. Data are presented as means ± s.e.m, *: p<0.05, **: p<0.01, ***: p<0.001, ****: p<0.0001, one-way ANOVA with Tukey’s multiple comparisons test. D, Visual acuity of treated and CL non-treated OPTNΔC eyes measured by OKR at 8wpi. n = 8–16 mice. Data are presented as means ± s.e.m, *: p<0.05, **: p<0.01, ****: p<0.0001, paired t-test.

