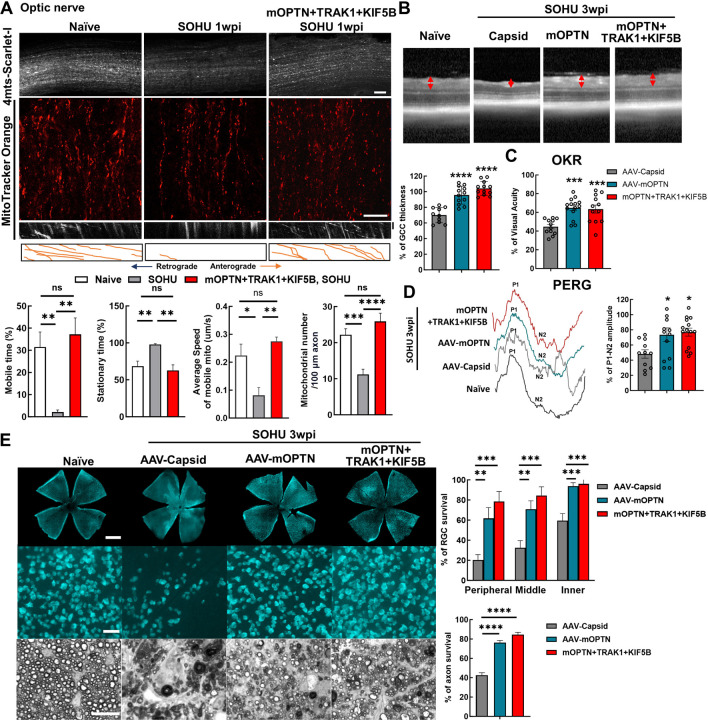
Figure 6. Ocular hypertension decreases ON mitochondrial transportation; OPTN/TRAK1/KIF5B reverses glaucomatous ON mitochondrial deficits and neurodegeneration in SOHU glaucoma model.
A, (top to bottom) Representative confocal images of ON wholemounts from naïve mice, SOHU mice at 1wpi and SOHU mice at 1wpi with mOPTN+TRAK1+KIF5B overexpression and AAV-4MTS-Scarlet labeling, Scale bars, 50 μm; representative ON wholemount images of the three groups with MitoTracker Orange labeling, Scale bars, 20 μm; kymograph and traces of MitoTracker labelled mitochondria movement along ON axons in the three groups. Vertical scale bar, 1 minute; quantification of each mitochondria’s time in motion and time stationary, average speed of each mobile mitochondrion and total mitochondria number in the axon. n = 17–30 mitochondria from 3 axons per group. Data are presented as means ± s.e.m, *: p<0.05, **: p<0.01, ***: p<0.001, ****: p<0.0001, ns, no significance, with Student’s t-test. B, Representative in vivo OCT images of SOHU mouse retinas at 3wpi. Quantification is represented as percentage of GCC thickness of glaucomatous eyes compared to the contralateral control eyes. n = 10–12 mice. C, Visual acuity measured by OKR at 3wpi, represented as percentage of glaucomatous eyes compared to the contralateral control eyes. n = 12–14 mice. D, Left: representative waveforms of PERG of SOHU mice at 3wpi. Right: quantification of P1-N2 amplitude of PERG at 3wpi, represented as percentage of glaucomatous eyes compared to the contralateral control eyes. n = 11–15 mice. E, Left, (top to bottom) representative confocal images of retina wholemounts showing surviving RBPMS-positive (cyan) RGCs at 3wpi. Scale bars, 50 μm; light microscopic images of semi-thin transverse sections of ON with PPD staining at 3wpi. Scale bars, 10 μm. Right, Quantification of surviving RGC somata and axons at 3wpi, represented as percentage of glaucomatous eyes compared with the sham contralateral control eyes. n = 10 mice. (B-E) All the data are presented as means ± s.e.m, *: p<0.05, **: p<0.01, ***: p<0.001, ****: p<0.0001, one-way ANOWA with Turkey’s multiple comparison tests, compared to AAV-Capsid treated control group.

