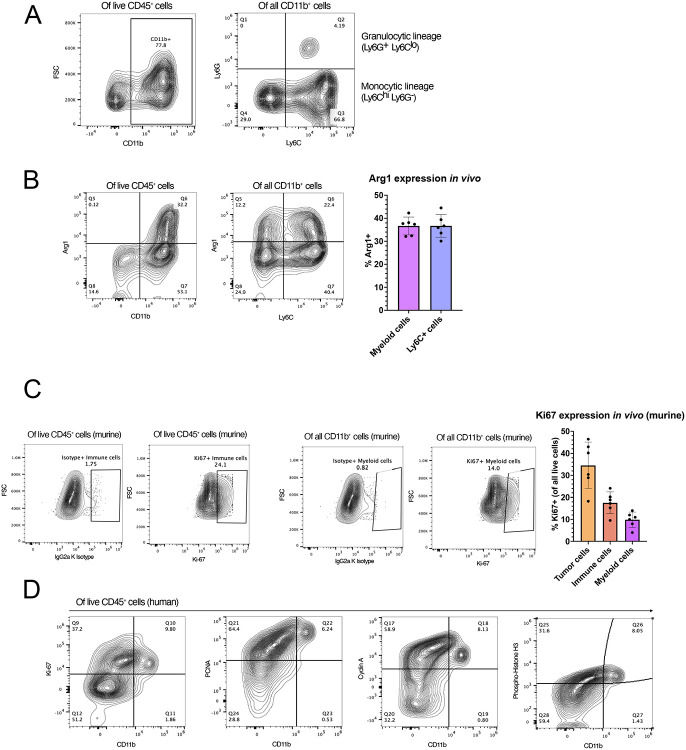
Figure 1. Human and murine glioblastoma contain proliferating myeloid cell populations.
(A) Characterization of SB28 intra-tumoral myeloid cell populations. Tumors were harvested on day 18 post-tumor inoculation and analyzed by flow cytometry. The left panel shows live myeloid cells (CD45+ CD11b+); the right panel shows M-MDSCs (CD45+ CD11b+ Ly6Chi Ly6G−) and PMN-MDSCs (CD45+ CD11b+ Ly6G+ Ly6Clo). (B) Flow cytometric analysis of Arg1 expression in all myeloid cells (CD45+ CD11b+) and M-MDSCs (CD45+ CD11b+ Ly6C+). Bars represent mean of 6 biological replicates. (C) Expression of intracellular Ki67 expression in immune (CD45+) and myeloid (CD45+ CD11b+) cells. IgG2a K isotype was used to define gates. Bar graph (right) represents in vivo expression of Ki67 in tumor, immune, and myeloid cells. Bars show the mean of 6 biological replicate samples. (D) Expression of proliferation markers Ki67, PCNA, Cyclin A, and Phosphorylated Histone H3 in human primary GBM samples. Flow cytometry plots are pre-gated for live CD45+ immune cells.

