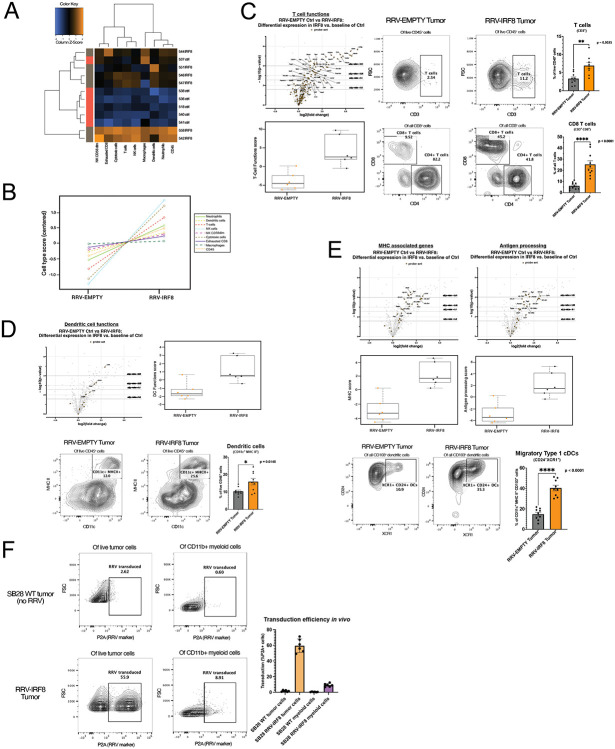
Figure 4. IRF8 transduction enhances the number of glioblastoma-infiltrating T-cells and type 1 conventional dendritic cells.
(A) Heatmap of differential expression of immune cell types between RRV-EMPTY (red bars, n=6 biological replicates), and RRV-IRF8 groups (grey bars, n=6 biological replicates). Total RNA was isolated from day 18 tumors. (B) Immune cell type changes between groups. Each cell type is associated with a set of genes; differential expression of gene sets is correlated with cell type abundance. Cell type profiling algorithm was previously described by Danaher et al (PMID: 28239471). (C) Left panel, volcano and box-and-whisker plots derived from the expression of T-cell genes (Supp. Table 2). In volcano plots, circular dots represent all differentially expressed genes; T-cell genes are represented with squares. Dashed horizontal lines correspond with adjusted p-value cut-offs. Right, representative flow plots of pan T-cells (CD45+ CD3+) and CD4 (CD45+ CD3+ CD4+) or CD8 (CD45+ CD3+ CD8+) T-cells. Bars represent the mean of 9 biological replicates. (D) Volcano and box-and-whisker plots derived from the expression of DC genes (Supp. Table 3). Representative flow plots of the pan-DC population (CD45+ CD11c+ MHC II+). Bars represent the mean of 9 biological replicates. (E) Volcano and box-and-whisker plots derived from the expression of MHC-associated or antigen-processing genes (Supp. Table 4). Bottom panels show flow cytometric analyses of CD103+ DCs derived from day 18 tumors. Live cells were gated on CD45+ CD11b− CD11c+ MHC II+ and CD103. The cDC1 populations were further refined by selecting CD24+ XCR1+, markers for terminally differentiated cDC1s capable of antigen cross-presentation. Bars represent the mean of 9 biological replicates. (F) Representative flow plots of in vivo RRV transduction using P2A as the marker for transduced cells. Top panels are SB28 WT (no RRV; non-transduced) tumors; the bottom panels are RRV-IRF8 tumors. Bars represent mean of 6 biological replicates.

