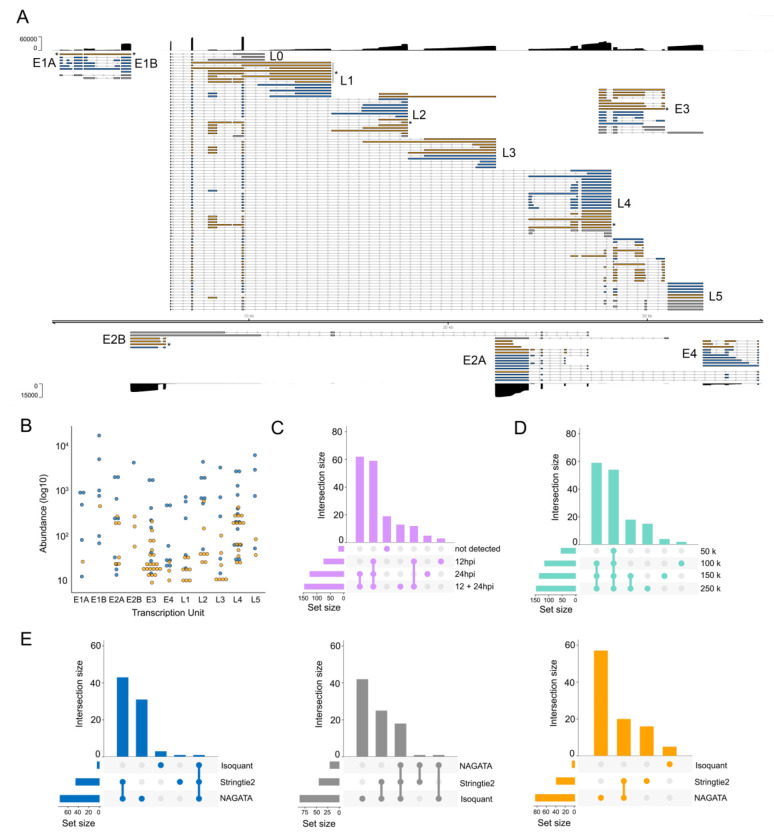
Figure 5: Reconstruction of the adenovirus type 5 transcriptome.
(A) Schematic depicting the HAdV-C5 transcriptome as constructed by NAGATA using merged DRS datasets representing 12 and 24 hours post infection (hpi) of A549 cells. Read coverage is shown for each strand (black) with the y-axis denoting read depth. Major transcription units (e.g. E1A) are indicated in black text while individual transcripts are coloured according to classification (orange = not present in existing annotation, blue = present in existing annotation, grey = reported in existing annotation but not detected by NAGATA in this dataset). Wide and thin boxes indicate canonical CDS domains and UTRs, respectively. Black asterisks denote transcripts putatively classified as unspliced pre-mRNAs. (B) For each detected transcript in each transcription unit, a raw abundance count was generated using NAGATA and colour-coded according to transcript classification. (C) Upset plot denoting the number of transcripts reported by NAGATA in the individual 12 hpi and 24 hpi datasets and merged 12 + 24 hpi dataset. (D) Upset plot denoting the number of transcripts reported by NAGATA in the merged 12 + 24 hpi dataset after random subsampling of reads. (E) Upset plots denoting the number of transcripts reported by NAGATA, StringTie2 (18), and Isoquant (20), segregated according to (blue) overlaps with existing annotation, (grey) not detected, and (orange) not present in original annotation.

