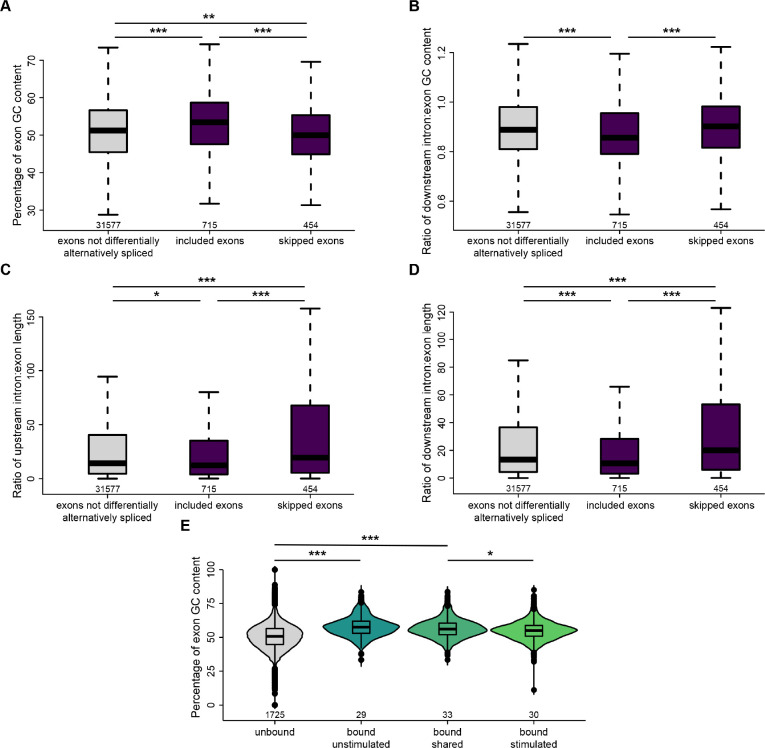
Figure 4: Srsf3 and PDGFRα signaling are associated with differential GC content and length of alternatively-spliced exons.
(A) Box and whisker plot depicting the percentage of exon GC content in exons that are not differentially alternatively spliced, and exons that are included or skipped when Srsf3 is present from the rMATS analysis. (B) Box and whisker plot depicting the ratio of downstream intron to exon GC content in exons that are not differentially alternatively spliced, and exons that are included or skipped when Srsf3 is present from the rMATS analysis. (C,D) Box and whisker plots depicting the ratio of upstream intron to exon length (C) and downstream intron to exon length (D) in exons that are not differentially alternatively spliced, and exons that are included or skipped when Srsf3 is present from the rMATS analysis. (E) Violin and box and whisker (inset) plots depicting the percentage of exon GC content in exons that are not bound by Srsf3, and exons that are bound in the absence and/or presence of PDGF-AA stimulation from the eCLIP analysis. *, P < 0.05; **, P < 0.01; ***, P < 0.001.

