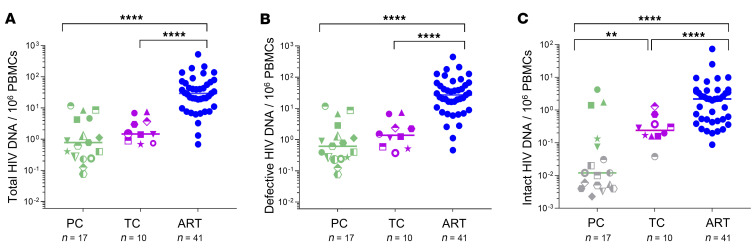
Figure 2. Analysis of HIV-1 proviral sequences in PCs, TCs, and participants on ART.
(A) Total, (B) defective, and (C) intact provirus levels in PCs, TCs, and participants on ART. Grey dots represent values below the limit of detection (expressed as 0.05 copy/total number of analyzed cells without target identification). PCs and TCs are represented by unique identifiers (Supplemental Tables 1 and 2). Each dot represents a participant. Mann-Whitney U test was used to compare PCs, TCs, and participants on ART. P < 0.05 was considered statistically significant. **P ≤ 0.01, ****P ≤ 0.0001.

