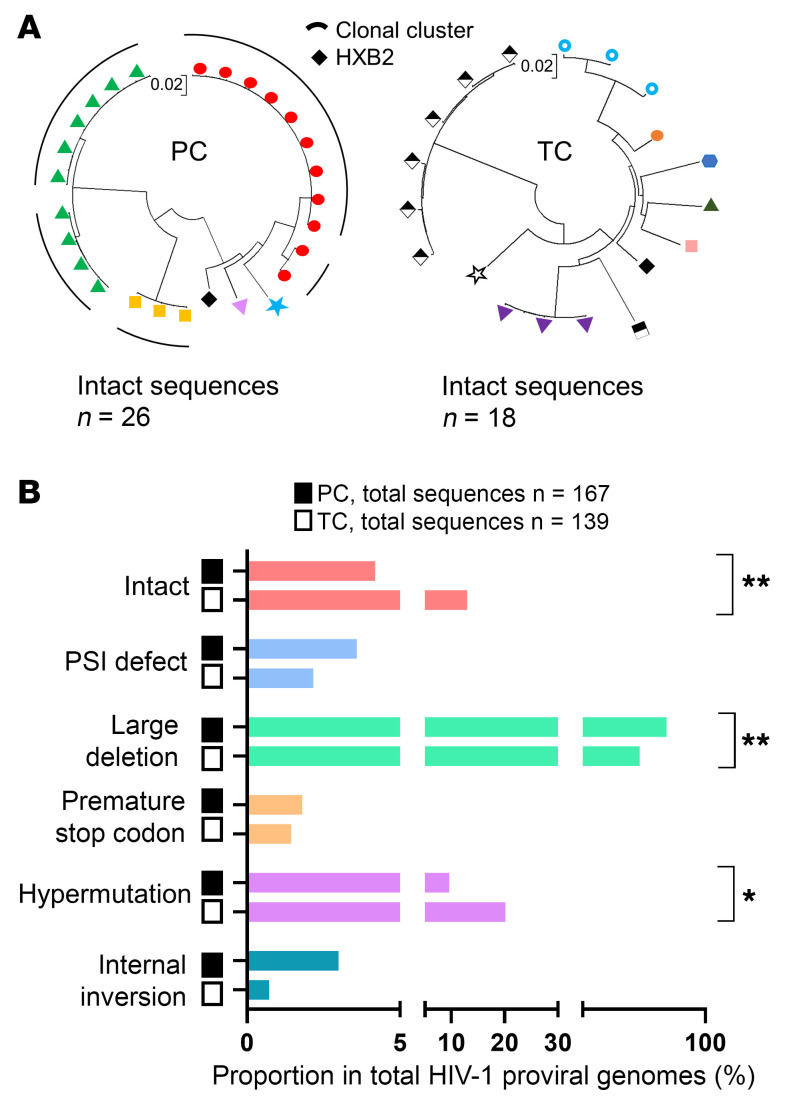
Figure 3. Genome-proviral sequences in PCs and TCs.
(A) Circular maximum-likelihood phylogenetic trees for all genome-intact proviral sequences from PCs and TCs. HXB2 was used as the reference HIV-1 sequence. Dots with the same colors represent genome-intact proviral sequences from the same participant. Clonal sequences are indicated by black arches. PCs and TCs are represented by unique identifiers (Supplemental Tables 1 and 2). (B) Proportions of nonclonal genome-proviral sequences. Intact and defective proviruses as packaging signal defect (PSI), large deletion (LD), premature stop codon (PMSC) hypermutations and internal inversion, were included. FDR-adjusted 2-tailed Fisher’s exact tests were used to compare PCs and TCs. P < 0.05 was considered statistically significant. *P ≤ 0.05, **P ≤ 0.01.

