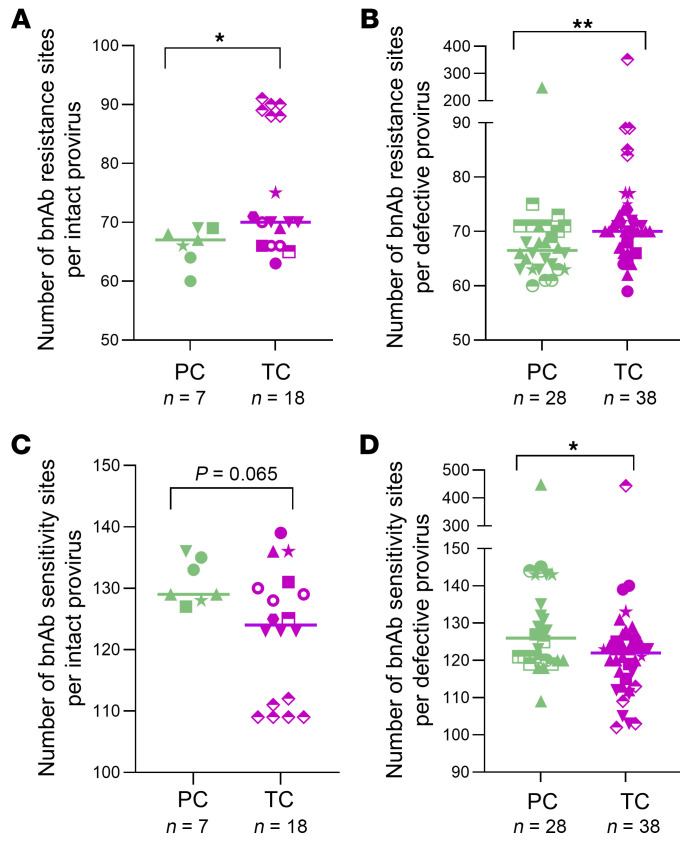
Figure 7. Analysis of bnAb resistance and sensitivity signature sites in intact and defective proviral sequences of PCs and TCs.
Number of bnAb resistance sites per (A) intact and (B) defective provirus in PCs and TCs. Number of bnAb sensitivity sites per (C) intact and (D) defective provirus in PCs and TCs. Each dot represents an intact or defective proviral sequence. PCs and TCs are represented by unique identifiers (Supplemental Table 1 and 2). Mann-Whitney U test was used to compare PCs and TCs. P < 0.05 was considered statistically significant. *P ≤ 0.05, **P ≤ 0.01.

