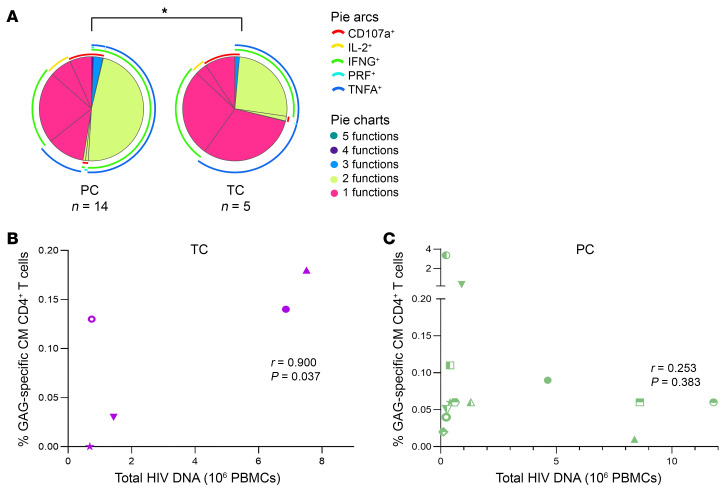
Figure 8. HIV-1-specific T-cell response in PCs and TCs.
(A) HIV-1-specific CM CD4+ T cell polyfunctionality with up to 5 functional responses to Gag stimulation per T cell in PCs and TCs. The 5 functional responses to Gag stimulation represent the simultaneous production of IFNG, TNFA, IL-2, CD107a, and PRF per T cell. IFNG, TNFA, IL-2, CD107a, and PRF are shown in arcs in the polyfunctional distribution. Pestle and Spice were used for analysis. Correlations between Gag-specific CM T cell response with total HIV DNA levels (106 peripheral blood mononuclear cells [PBMCs]) in (B) TCs and (C) PCs. Each dot represents a participant. PCs and TCs are represented by unique identifiers (Supplemental Table 1 and 2). Spearman test was used for nonparametric correlations. *P ≤ 0.05.

