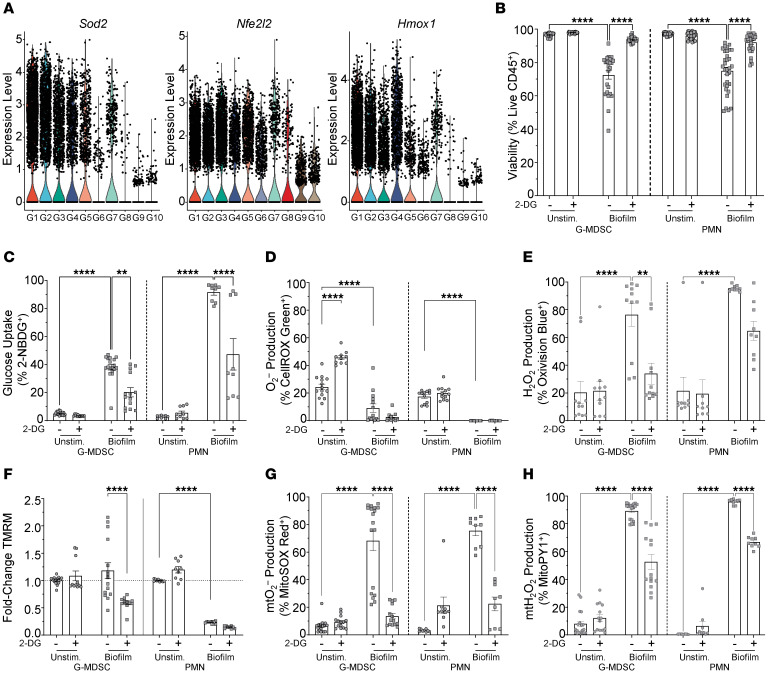
Figure 4. Granulocyte glycolysis induced by S. aureus biofilm is linked to ROS generation.
(A) Expression levels of ROS-related genes in granulocyte clusters identified by scRNA-Seq in the mouse PJI model. (B–H) Primary G-MDSCs or PMNs were treated with either vehicle or 2-DG for 1 hour prior to S. aureus biofilm coculture for 30 minutes, whereupon granulocytes were evaluated for (B) cell viability (G-MDSC, n = 24/group; PMN, n = 32/group), (C) glucose uptake (2-NBDG) (G-MDSC, n = 18 for vehicle and n = 14 for 2-DG; PMN, n = 9/group), (D) O2– (CellROX Green) (G-MDSC, n = 14 for vehicle and n = 10 for 2-DG; PMN, n = 12/group), (E) H2O2 (OxiVision) (G-MDSC, n = 11/group; PMN, n = 9/group), (F) mitochondrial transmembrane potential (mtMP; TMRM) (G-MDSC, n = 15 for vehicle and n = 11 for 2-DG; PMN, n = 9/group), (G) mtO2– (MitoSOX) (G-MDSC, n = 18 for vehicle and n = 14 for 2-DG; PMN, n = 9/group), and (H) mtH2O2 (MitoPY) (G-MDSC, n = 18 for vehicle and n = 14 for 2-DG; PMN, n = 9/group). Results, excluding TMRM, are represented as means ± SEM of positively stained cells. TMRM data are represented as means ± SEM fold change in granulocytes cocultured with biofilm versus unstimulated cells. Viability data are represented as means ± SEM of viable cells. **P < 0.01; ****P < 0.0001, 1-way ANOVA with Tukey’s correction.

