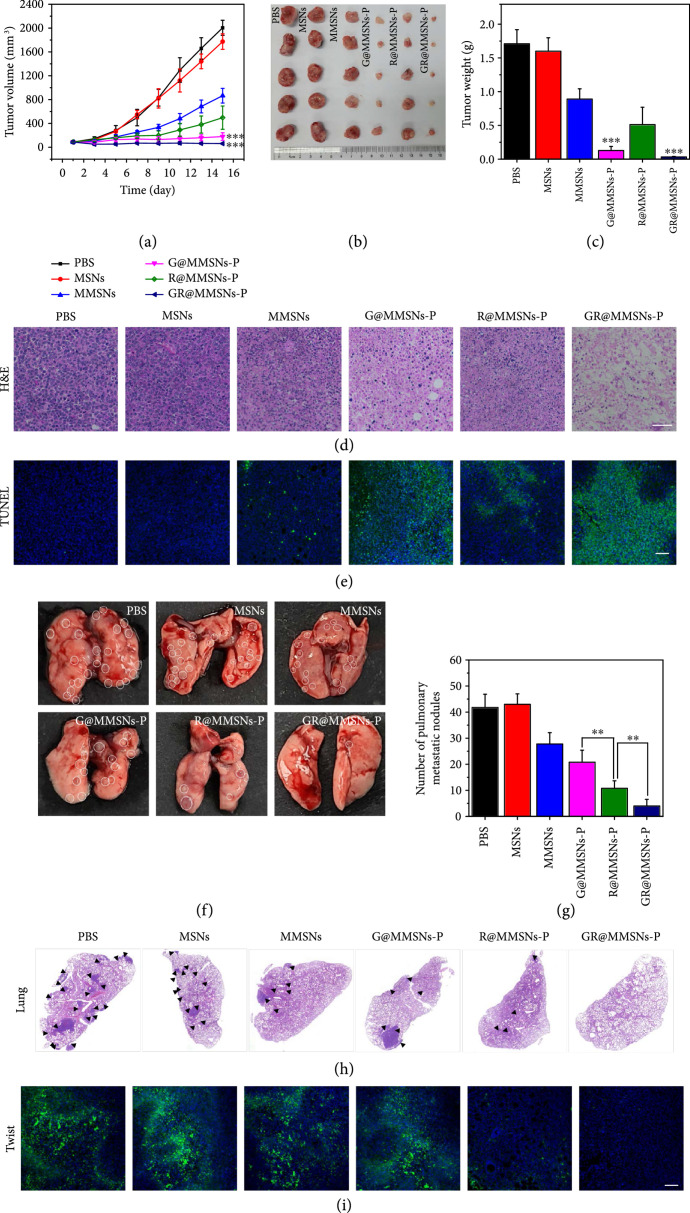
Figure 7.
In vivo therapeutic efficacies. (a) Tumor growth curves of the mice bearing the 4T1 tumor during the experiment. (b) Photographs and (c) weights of the tumors removed from the mice bearing the 4T1 tumor in different groups at the end of treatment. (d) H&E staining (scale bar, 50 μm) and (e) TUNEL assay (scale bar, 100 μm) of tumor tissues at the end of treatment. (f) Representative photographs and (h) H&E-stained lung tissues of 4T1 tumor-bearing mice in different treatment groups. (g) Quantitative analysis of pulmonary metastatic nodules in different groups. (i) The immunofluorescence analysis of Twist protein expressions in primary tumors with the different treatments. Scale bar, 100 μm. All statistical data were presented as (). **P < 0.01 and ***P < 0.001.

