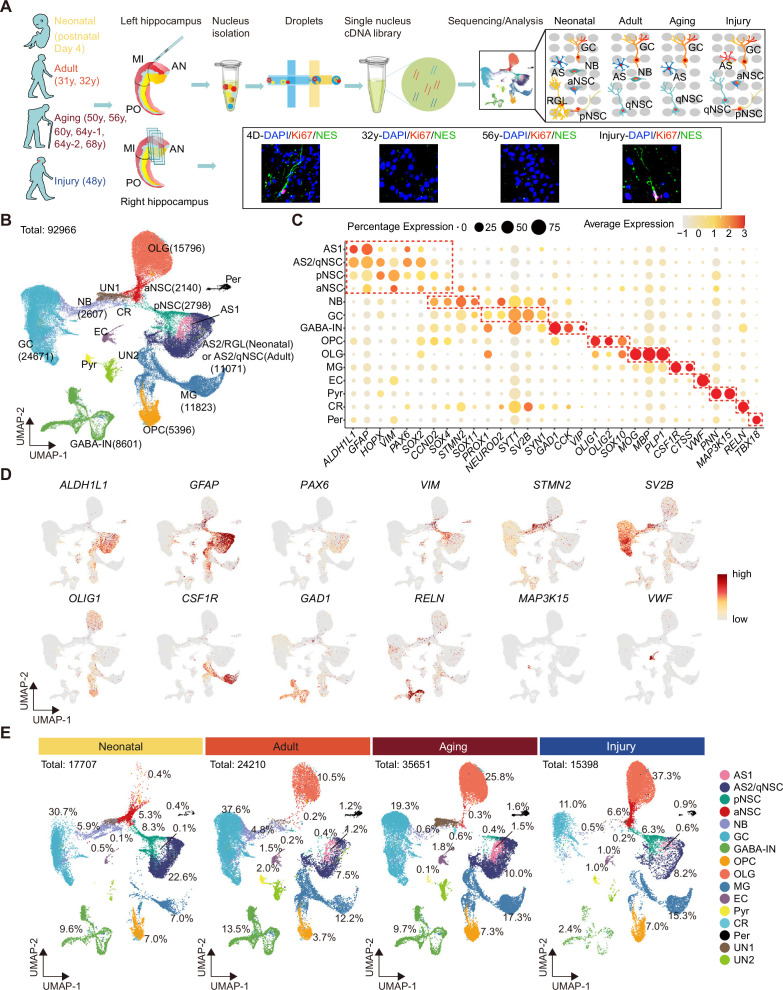
Figure 1. Single-nucleus transcriptomic atlas of the human hippocampus across different ages and after stroke injury.
(A) Summary of the experimental strategy. The pair of hippocampi from post-mortem human donors at different ages were collected. The anterior (AN) and middle (MI) parts containing dentate gyrus were used for single-nucleus RNA-seq (snRNA-seq) and immunostaining. (B) 92,966 hippocampal single nuclei were visualized by Uniform Manifold Approximation and Projection (UMAP) plot and categorized into 16 major populations: astrocyte1 (AS1, 1146 nuclei), astrocyte2/quiescent neural stem cell (AS2/qNSC, 11,071 nuclei), primed NSC (pNSC, 2798 nuclei), active NSC (aNSC, 2140 nuclei), neuroblast (NB, 2607 nuclei), granule cell (GC, 24,671 nuclei), interneuron (IN, 8601 nuclei), pyramidal neuron (PN, 676 nuclei), oligodendrocyte progenitor (OPC, 5396 nuclei), oligodendrocyte (OLG, 15,796 nuclei), microglia (MG, 11,823 nuclei), endothelial cell (EC, 1232 nuclei), pericyte (Per, 981 nuclei), Relin-expressing Cajal-Retzius cell (CR, 218 nuclei), and two unidentified populations (UN1 and UN2, 3810 nuclei). (C) Dot plots of representative genes specific for the indicated cell subtypes. The size of each dot represents the cell percentage of this population positive for the marker gene. The scale of the dot color represents the average expression level of the marker gene in this population. (D) UMAP feature plots showing expression distribution of cell type-specific genes in all cell populations. Astrocyte (ALDH1L1, GFAP), NSC (PAX6, VIM), neuroblast (STMN2), GC (SV2B), oligodendrocyte progenitor (OLIG1), microglia (CSF1R), interneuron (GAD1, RELN), Relin-expressing Cajal-Retzius cell (RELN), pyramidal neuron (MAP3K15), and endothelial cell (VWF) are shown. Dots, individual cells; gray, no expression; red, relative expression (log-normalized gene expression). (E) Quantification of each cell population in the hippocampus at three different age stages and after stroke-induced injury.


