. 2024 Apr 12;12:RP89507. doi: 10.7554/eLife.89507

Figure 5. Age-dependent molecular alterations of the hippocampal neural stem cells (NSCs) and neuroblasts (NBs).

(A and B) Feature plots (A) and quantification (B) of the neurogenic populations during aging. Neonatal (abbreviated as N), adult ( abbreviated as Ad), aging ( abbreviated as Ag). The neurogenic populations include qNSC1, qNSC2, pNSC, aNSC, and neuroblast. (C) The dynamic expression of some representative genes, including newly identified qNSCs genes (LRRC3B, RHOJ, and SLC4A4), NSC genes (HOPX, SOX2, VIM, NES, and CHI3L1), neural progenitor or proliferation genes (ASCL1, EOMES, and MKI67), and immature granule cell genes (STMN2 and DCX), in human hippocampus across neonatal (postnatal day4), adult (31y, 32y), and aging (50y, 56y, 60y, 64y-1, 64y-2, 68y). (D) Immunostaining of classical NSC markers (HOPX, VIM, and NES) in human hippocampal dentate gyrus across different ages (postnatal day 4, 32y, 50y, 56y). Scale bars, 60 μm. The arrowheads indicate positive cells with typical morphology. (E) Violin plot showing differentially expressed genes of qNSC1 and qNSC2 in the aging group compared to the neonatal group. (F) Representative gene ontology (GO) terms of significantly (p-value <0.05) up- and down-regulated genes in qNSC1 and qNSC2 during aging.

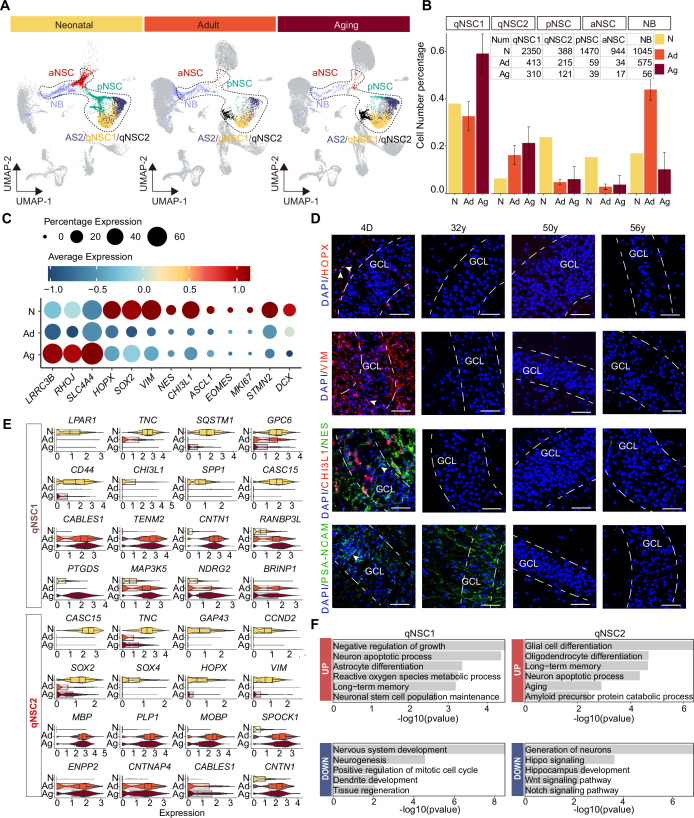
Figure 5—source data 1. Genes and enriched gene ontology (GO) terms of qNSC1, qNSC2, primed neural stem cell (pNSC), active NSC (aNSC), and neuroblast (NB) populations during aging.

Figure 5.

Figure 5—figure supplement 1. Alterations of the neurogenic lineage in human hippocampus during aging.

Figure 5—figure supplement 1.

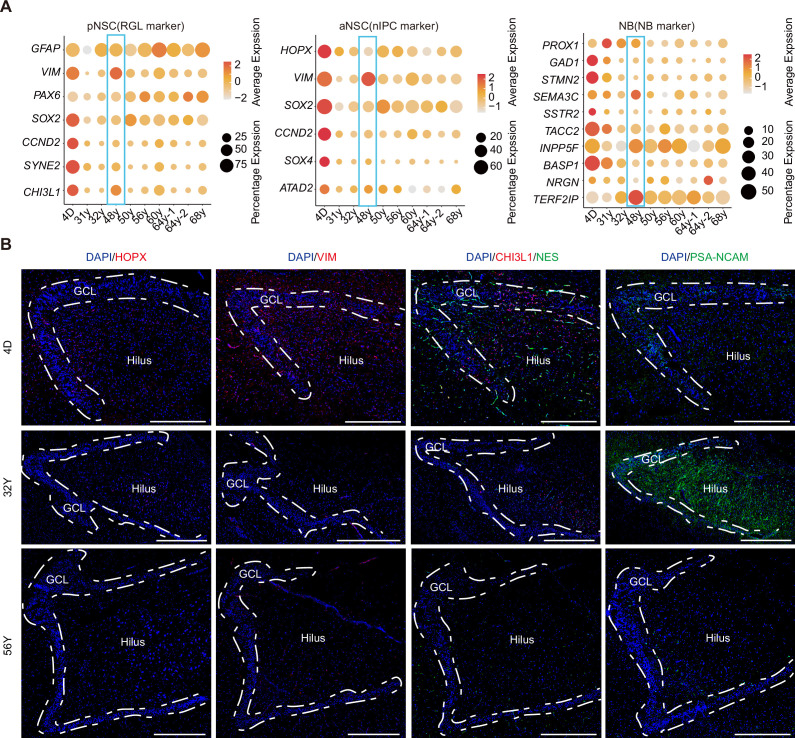
(A) Bubble plots showing our identified primed neural stem cells (pNSCs), active NSCs (aNSCs), and neuroblasts (NBs) from 10 individuals still express NSC and NB marker genes during aging despite their rare number. 48y donor was a stroke sample. (B) Immunostainings of classical NSC markers (HOPX, VIM, and NES), pNSC gene CHI3L1 identified by us, and neuroblast marker PSA-NCAM in human hippocampal dentate gyrus across different ages (postnatal day 4, 32y, and 56y). Scale bars: 4D – 500 μm, 32y – 800 μm, 56y – 600 μm.
Figure 5—figure supplement 2. Differentially expressed genes (DEGs) and enrichment functions in primed neural stem cell (pNSC), active NSC (aNSC), and neuroblast (NB) along aging, respectively.

Figure 5—figure supplement 2.

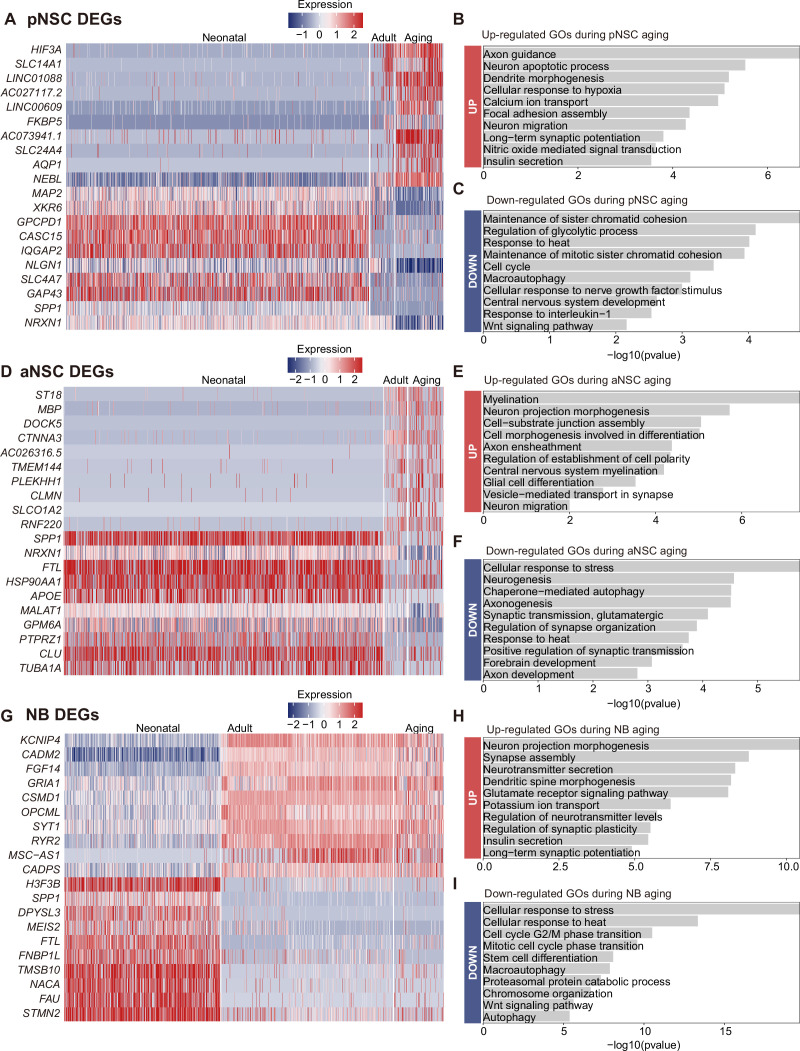
(A) Heatmap showing DEGs across neonatal, adult, aged pNSC (p-value <0.05). (B and C) Representative gene ontology (GO) terms of significantly up-regulated (B) and down-regulated (C) genes during pNSC aging (GO:BP, selected neural development related GO terms from top 200, p-value <0.05). (D) Heatmap showing DEGs across neonatal, adult, aged aNSC (p-value <0.05). (E and F) Representative GO terms of significantly up-regulated (E) and down-regulated (F) genes during aNSC aging (GO:BP, neural development related GO terms, p-value <0.05). (G) Heatmap showing DEGs across neonatal, adult, aged NB (p-value <0.05). (H and I) Representative GO terms of significantly up-regulated (H) and down-regulated (I) genes during NB aging (GO:BP, neural development related GO terms, p-value <0.05).