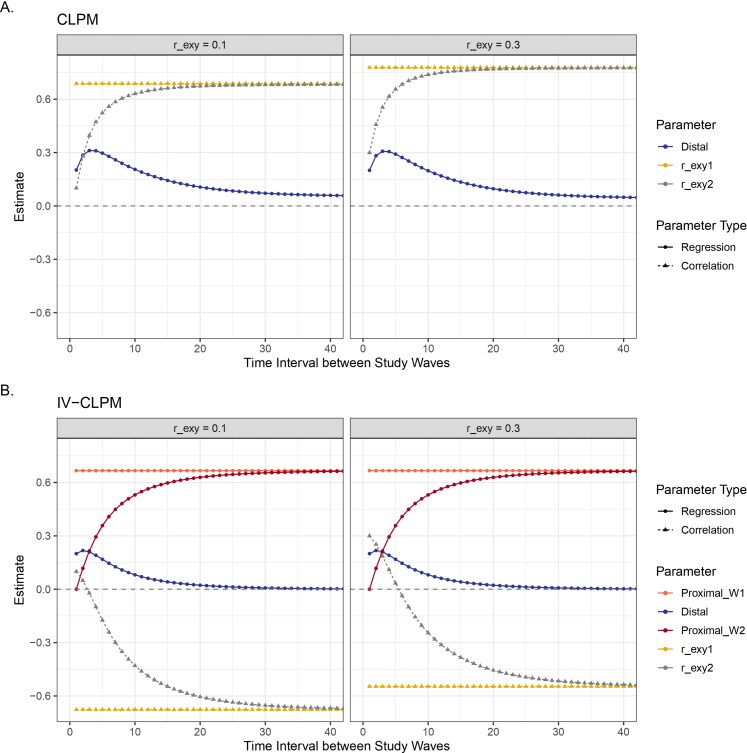
Figure 6.
Variation in the causal estimates (effect of X on Y) and the cross-sectional correlation between the residuals of X and Y in (A) the CLPM and (B) the IV-CLPM, at varying levels of correlation between the residuals in the data (r_exy). The residual correlation in the data has a negligible impact on the causal estimates in either model, but affects the correlation of the residuals in the model, r_exy1 and r_exy2. Given stationarity, the correlation of the residuals also varies with changes in the causal estimates, which, in turn, depend on the time interval between study waves. For ease of display, the time intervals are shown up to 40 units, by which point all parameter estimates are close to their asymptotes.

