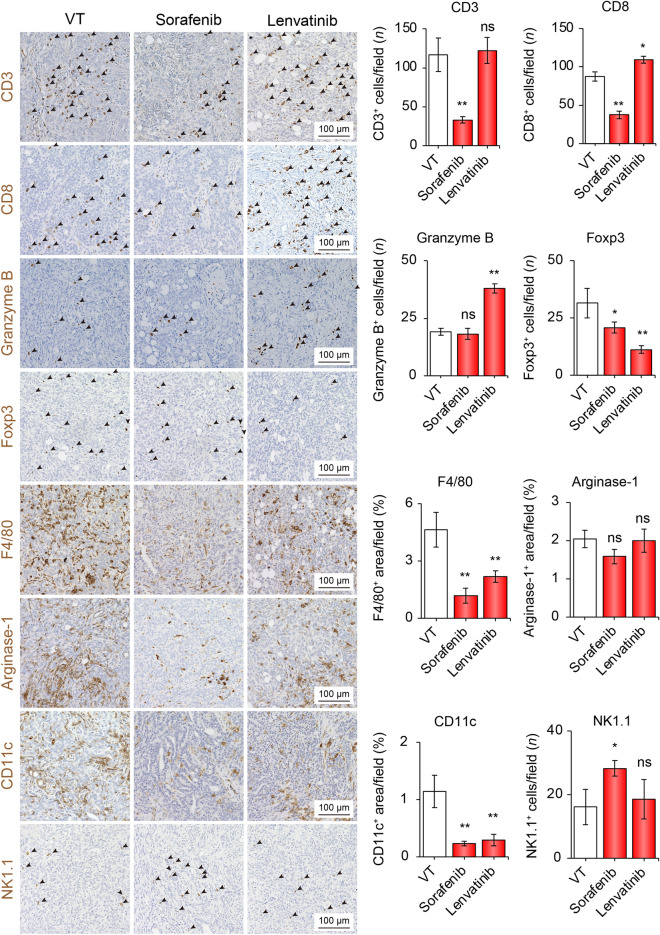
Fig. 1.
Sorafenib or lenvatinib treatment altered the tumor immune microenvironment. Representative micrographs (left panel) and quantification (right panel) of CD3-positive, CD8-positive, Granzyme B-positive, Foxp3-positive, F4/80-positive areas, Arginase-1-positive areas, CD11c-positive, and NK1.1-positive cells in the VT, sorafenib, and sorafenib groups, respectively. *p < 0.05, **p < 0.01 vs. VT, one-way ANOVA. Data are presented as mean ± SEM. VT vehicle treatment, ns no significance

