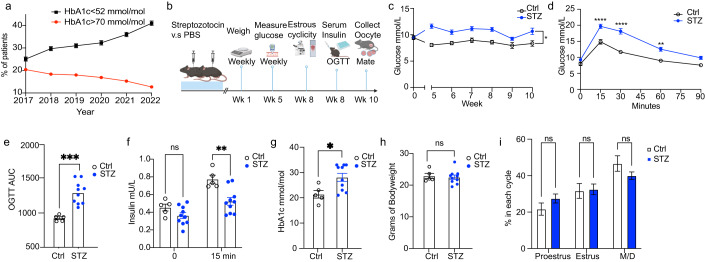
Figure 1. Phenotyping of a model of appropriately managed type 1 diabetes.
(A) Trends in glycemic control for all women of reproductive age (18–45 years of age, n = 9771 2017, n = 9951 2018, n = 9983 2019, n = 9536 2020, n = 9964 2021, n = 10129 2022) with a type 1 diabetes diagnosis in Sweden between 2017 and 2022. Red color indicates percentage (%) of patients with bad glycemic control (HbA1c > 70 mmol/mol). Black color indicates percentage (%) of patients with good glycemic control (HbA1c < 52 mmol/mol). (B) Schematic for mouse experiment of optimized STZ model. (C) Trends of morning blood glucose levels in Control and STZ groups over the time course of the experiment. (D) Blood glucose levels at different timepoints during an oral glucose tolerance test (OGTT). (E) Glucose area under the curve (AUC) from the OGTT experiment in (C). (F) Serum insulin levels at 0 and 15 min timepoints from OGTT experiment in (B). (G) HbA1c levels 10 weeks after induction. (H) Body weight of mice 10 weeks after STZ exposure. (I) Time spent in every phase of estrous cyclicity. STZ, Streptozotocin; HbA1c, glycated hemoglobin; M/D, Metestrus/Diestrus. Data information: Data depicted here is in biological replicates. In panels (C–I), data is presented as mean ± SEM. In panel (C), data was analyzed using 2-way ANOVA. In panels (D), (F) and (I), data was analyzed using two-way ANOVA with Bonferroni’s post hoc test. In panels (E), (G) and (H), data was analyzed using Student’s t-test. *P < 0.05, ***P < 0.001; ****P < 0.0001 (n = 5 for control mice, n = 10 for STZ mice for panels (C–I)). Source data are available online for this figure.

