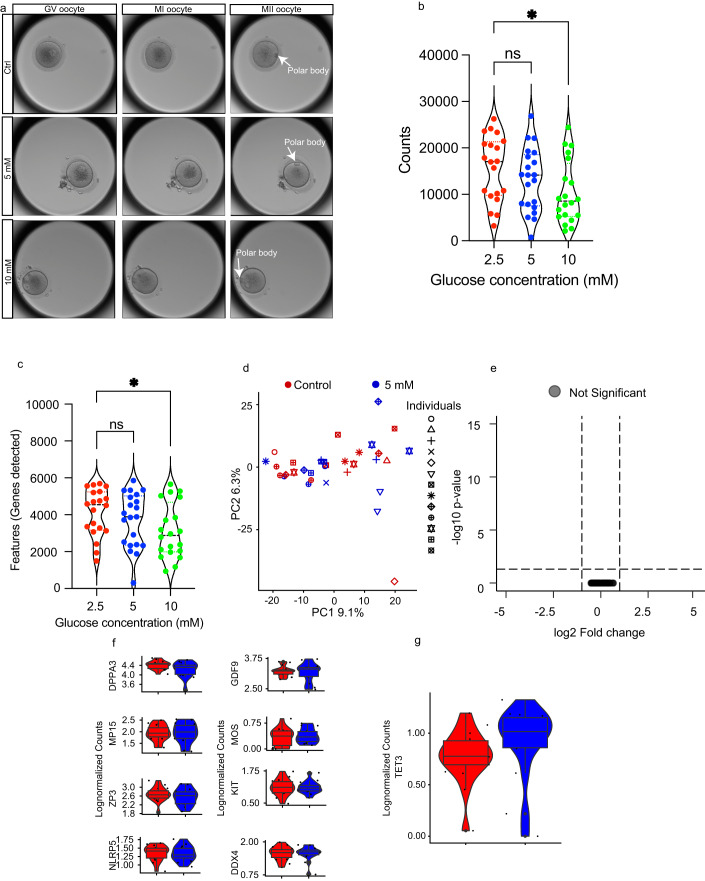
Figure 3. Human oocyte analyses.
(A) Representative images for in vitro maturation of oocyte in control (2.5 mM), 5 mM, and 10 mM conditions. Images show the same oocyte in GV (germinal vesicle), MI (Metaphase I), and MII (Metaphase II) stage during maturation. (B) Number of counts (UMIs) for every cell for MII oocytes (n = 20 for 2.5 mM, n = 21 for 5 mM, n = 20 for 10 mM) (C) number of genes/features detected per cell for MII oocytes. (D) PCA plot of oocytes cultured in control (2.5 mM) and mildly diabetic (5 mM) conditions (n = 20 for 2.5 mM, n = 21 for 5 mM, n = 20 for 10 mM). (E) Volcano plot displaying no differentially expressed genes between oocytes undergoing IVM in control and mildly diabetic conditions. (F) Violin plots depicting oocyte-specific genes. (n = 17 control oocytes, n = 16 5 mM oocytes). (G) Violin plot depicting TET3 levels in human oocytes (n = 17 control oocytes, n = 16 5 mM oocytes). UMI, Unique Molecular Identifier. Data information: Data depicted here is in biological replicates. In panels (B) and (C), data was analyzed using one-way ANOVA with Bonferroni’s post hoc test. In panel e, data was analyzed using MAST. For boxplots in panels (F) and (G), the lower and upper hinges of the box depict the 1st and 3rd quartiles, and the middle line depicts the median. The upper and lower whiskers extend to the largest or smallest value no further than 1.5 times the interquartile range (1.5*IQR) from the hinge. Data beyond the end of the whiskers are plotted as a larger dot, which are then the minimum and/or maximum values depicted. If no large dots are present, the whiskers extend to the minimum and/or maximum values. *P < 0.05. Source data are available online for this figure.

