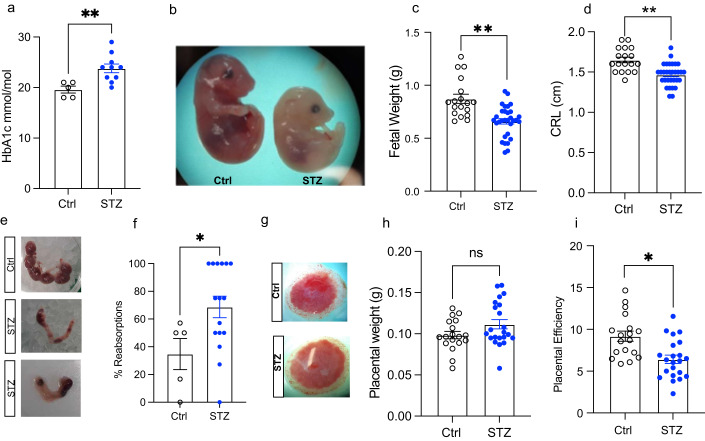
Figure 4. Mouse fetal development study.
(A) HbA1c levels at end of experiment (n = 5 control mice, n = 10 STZ mice). (B) Representative image for Control (left) and STZ (right) embryo. (C) Embryo weight of embryos derived from Control (n = 18) and STZ (n = 31) mice. (D) Crown-rump length (CRL) of control (n = 18) and STZ (n = 31) embryos at E18.5. (E) Representative images of uteruses at E18.5. Uterus with no reabsorption (top, Control) and with several both early and late reabsorptions (middle and bottom, STZ). (F) Percentage of embryos reabsorbed at E18.5 (n = 5 control and n = 16 STZ). (G) Representative images for placentas at E18.5. (H) Placental weight from control (n = 18) and STZ (n = 22) fetuses at E18.5. (I) Placental efficiency of control (n = 18) and STZ (n = 22) placentas linked to embryos depicted in (B). STZ, Streptozotocin; HbA1c, glycated hemoglobin; CRL, Crown-rump length. Data information: Data depicted is biological replicates. In panels (A, C, D, F, H, I), data is depicted as mean ± SEM. In panels (A) and (F), data was analyzed using Student’s t-test. In panels (C), (D), (H) and (I) data were analyzed using analysis of covariance (ANCOVA) to correct for litter size. *P < 0.05, **P < 0.01. Source data are available online for this figure.

