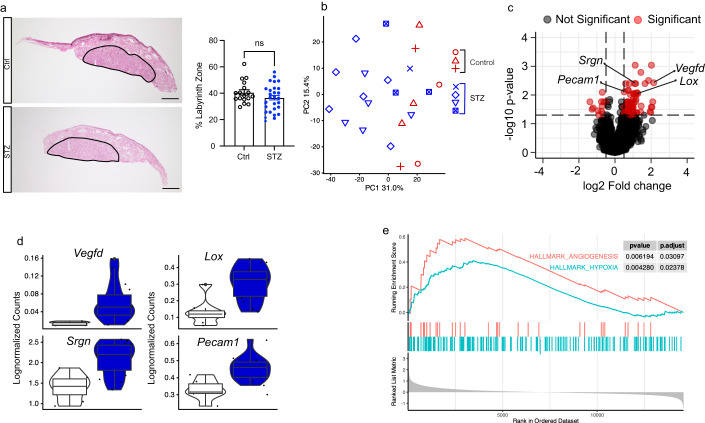
Figure 5. Histological and transcriptomic analysis of placentas.
(A) Hematoxylin and erythrosine staining with representative images and quantification analyzing labyrinth zone size in control (n = 17) and STZ (n = 30) placenta. Scale bar: 800 μm. (B) Principal component analysis (PCA) plot of control (n = 8) and STZ (n = 14) placenta RNAseq, symbols depicting which placentas belong to the same maternal mouse. (C) Volcano plot depicting results of differential expression analysis between control (n = 8) and STZ (n = 14) placentas. (D) Violin plots depicting individual gene expression of genes highlighted in (C)) in control (n = 8) and STZ (n = 14) placentas. (E) Enrichment plots of the hallmark Angiogenesis and Hypoxia gene sets generated by GSEA comparing control (n = 8) and STZ (n = 14) placentas. STZ, Streptozotocin; PCA, principal component analysis; GSEA, gene set enrichment analysis. Data information: Data depicted is biological replicates. For panel (A), data is depicted as mean ± SEM and was analyzed using Student’s t-test. For panel (C), data was analyzed using Wald test in DESeq2. For boxplots in panel (D), the lower and upper hinges of the box depict the 1st and 3rd quartiles, and the middle line depicts the median. The upper and lower whiskers extend to the largest or smallest value no further than 1.5 times the interquartile range (1.5*IQR) from the hinge. Data beyond the end of the whiskers are plotted as a larger dot, which are then the minimum and/or maximum values depicted. If no large dots are present, the whiskers extend to the minimum and/or maximum values. *P < 0.05. Source data are available online for this figure.

