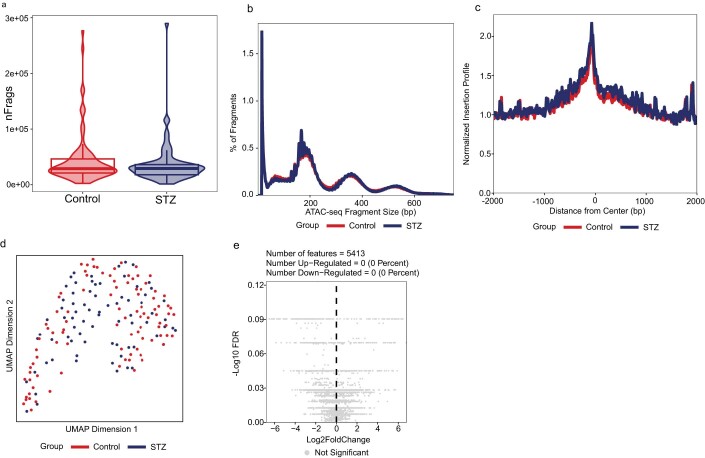
Figure EV3. Mouse oocyte single-cell ATAC seq analysis.
(A) Amount of unique fragments detected per cell from control (n = 95) and STZ oocytes (n = 85. (B) Fragment size distribution from control (n = 95) and STZ oocytes (n = 85 (C) TSS enrichment profile from control (n = 95) and STZ oocytes (n = 85). (D) UMAP depicting scATAC profiles from control (n = 95) and STZ oocytes (n = 85). (E) Volcano plot displaying no differentially accessible regions between control (n = 85) and STZ (n = 95) oocytes. TSS, Transcription starting site; UMAP, Uniform Manifold Approximation and Projection; STZ, Streptozotocin. Data information: Data depicted is biological replicates. For boxplots in panel (A), the lower and upper hinges of the box depict the 1st and 3rd quartiles, and the middle line depicts the median. The upper and lower whiskers extend to the largest or smallest value no further than 1.5 times the interquartile range (1.5*IQR) from the hinge. Data beyond the end of the whiskers are plotted as a violin plot, which are then the minimum and/or maximum values depicted.

