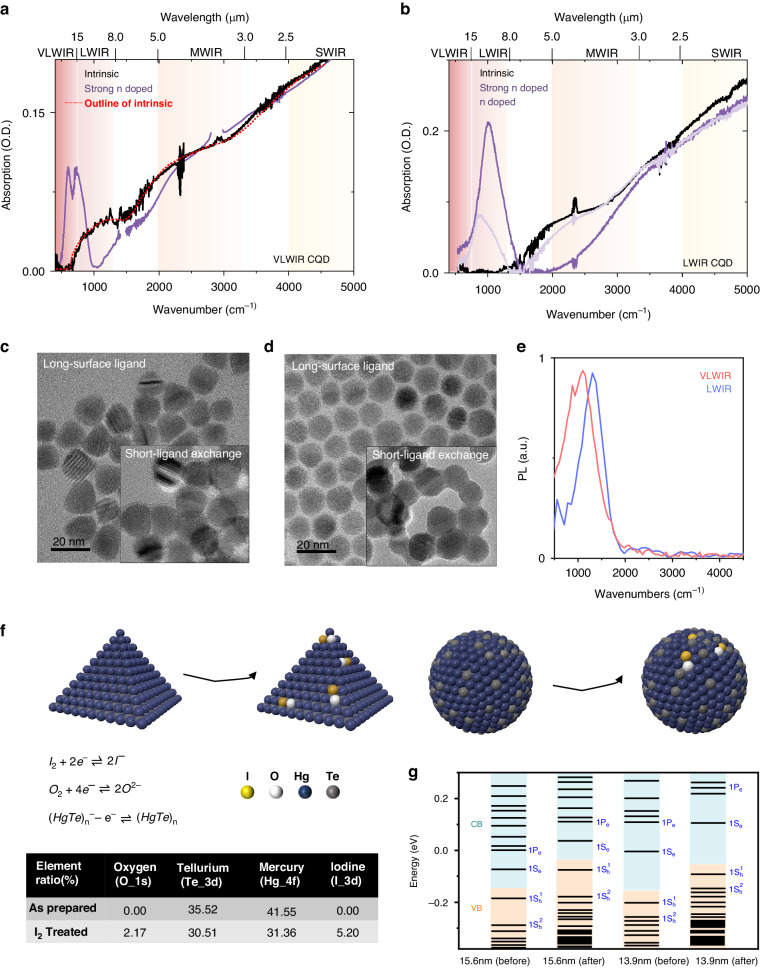
Fig. 1. HgTe CQD.
a, b Absorption spectra of VLWIR CQD and LWIR CQD with different doping at 300 K. c, d TEM of VLWIR and LWIR CQD dissolved in chlorobenzene solution, with the insert graph showing the CQD after ligand exchange dissolved in N,N-Dimethylformamide, respectively. e Photoluminescence spectra of I2 treated (intrinsic) VLWIR and LWIR CQD at 300 K. f A schematic diagram on as prepared and I2 treated tetrahedral and spherical CQD. The table shows the surface elements ratio on CQD before and after I2 treatment by XPS. g Calculated energy diagram on VLWIR and LWIR CQD before and after I2 treatment, respectively

