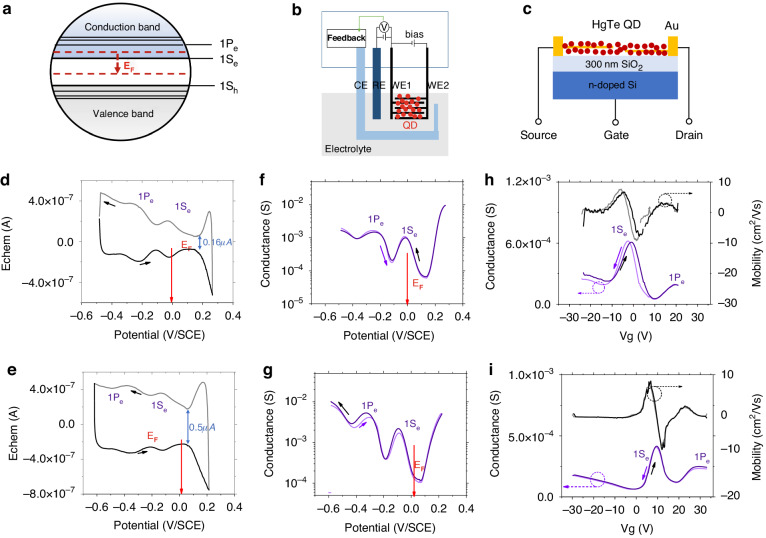
Fig. 2. Transport characterization.
a HgTe CQD Energy diagram. b, c Schematic diagram of electrochemistry and FET measurement, respectively. CE the counter electrode, RE the reference electrode, WE the working electrode. d, e Cyclic voltammetry on LWIR HgTe CQD before and after I2 treatment at 203 K, respectively. The arrows indicate forward and backward scan direction. Red arrows show the rest potential (Fermi Level) before the scan. f, g Conductance at different potential measured by electrochemistry with bi-potentiostat before and after I2 treatment, respectively. h, i FET transfer curve (purple lines) and differential mobility (black lines) at 80 K of HgTe CQD before and after I2 treatment, respectively

