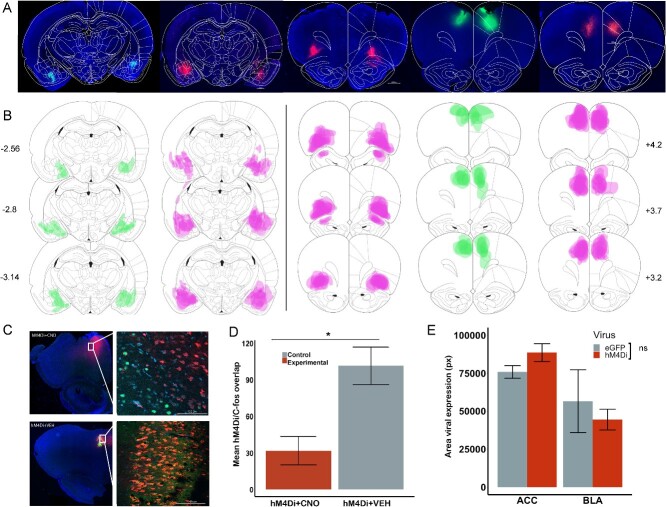
Fig. 2.
Inhibitory DREADDs in ACC, BLA, and OFC; validation of ACC inhibition via c-fos immunohistochemistry. A) Representative placement of inhibitory hM4Di DREADDs and eGFP null virus at the anterior–posterior (AP) level + 3.7 for ACC and OFC, and − 2.8 for BLA relative to Bregma. Note, there were no eGFP for OFC. B) Reconstructions of placement of inhibitory hM4Di DREADDs (pink) and eGFP null virus (green) at AP level + 4.2, +3.7 and +3.2 for ACC, OFC, and AP −2.56, −2.8, and − 3.14 for BLA relative to Bregma. C) Representative image showing DAPI (blue), hM4Di-mCherry (red), c-fos immunoreactivity (green), and their overlap after injections of CNO and VEH in ACC at 2.5× and 20×. D) Mean cell count of four images per condition, hM4Di + CNO, hM4Di + VEH for ACC. E) Mean spread of viral expression across brain regions; pixel quantification was done using ImageJ software. Ns = nonsignificant, *P < 0.05, Mann–Whitney U test.

