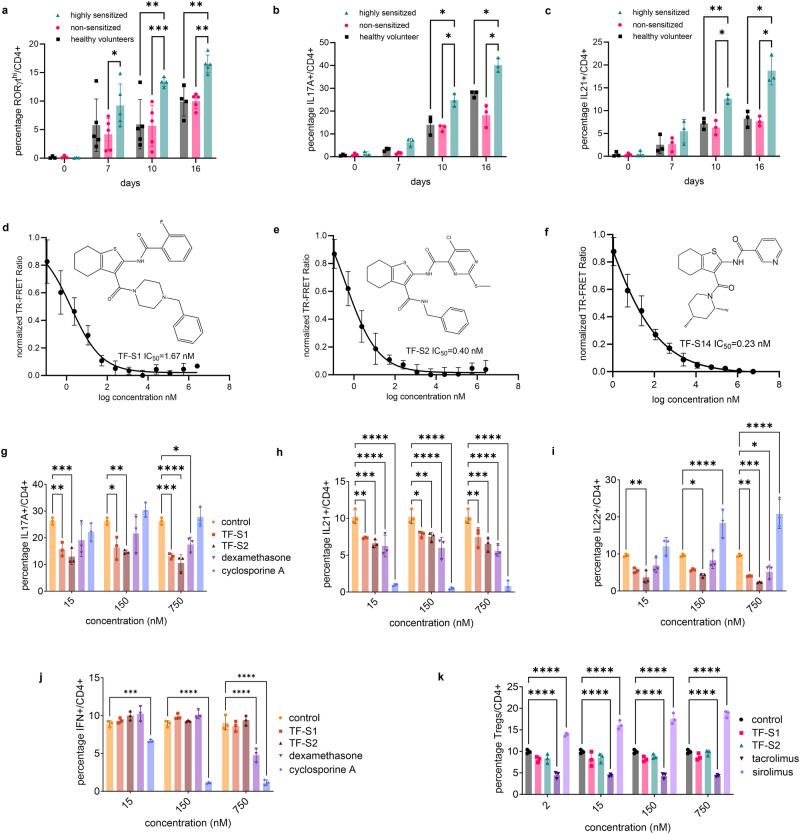
Fig. 1. In vitro Th17 polarization time course of human PBMCs from highly sensitized kidney transplantation candidates and the effect of RORγt inverse agonists on cytokine production from Th17, Th1 and Treg cells.
PBMCs from highly sensitized, non-sensitized transplantation candidates and healthy volunteers were polarized for 0, 7, 10, 16 days then stimulated with PMA/ionomycin/monensin/prefoldin cocktail for 5 h. The percentages of RORγthi/ (a), IL17A+/ (b) and IL21+/CD4+ cells (c) were measured by flow cytometry. Dose-response curves of TR-FRET assay of RORγt-LBD: serial dilutions of compounds TF-S2, TF-S10, TF-S14 were incubated with 1.5 nM GST−RORγt (LBD); 90 nM biotinylated RIP140 coactivator peptide; 50 nM streptavidin-APC; 1.5 nM Eu-anti GST. The data are represented as percentage TR-FRET ratio. IC50 of TF-S1, TF-S2 and TF-S14 were 1.67, 0.40 and 0.23 nM, respectively (d–f). Effect of TF-S1, TF-S2, cyclosporine A and dexamethasone on Th17 polarization: the percentages of IL17A+/ (g), IL21+/ (h) and IL22+/CD4+ cells (i) were measured by flow cytometry. Effect of TF-S1, TF-S2, cyclosporine A and dexamethasone on human PBMCs to Th1 polarization: the percentage of IFNγ+/CD4+ cells was measured on day 3 by flow cytometry (j). Effect of TF-S1, TF-S2, sirolimus and tacrolimus on human PBMCSs to Treg polarization: the percentage of CD127loCD25hiFOXP3+/CD4+ was measured on day 6 by flow cytometry (k). Data are presented as mean ± SD, *p < 0.05, **p < 0.01, ***p < 0.005, ****p < 0.001, two-way ANOVA and Tukey’s test, n = 3–5 per group.

