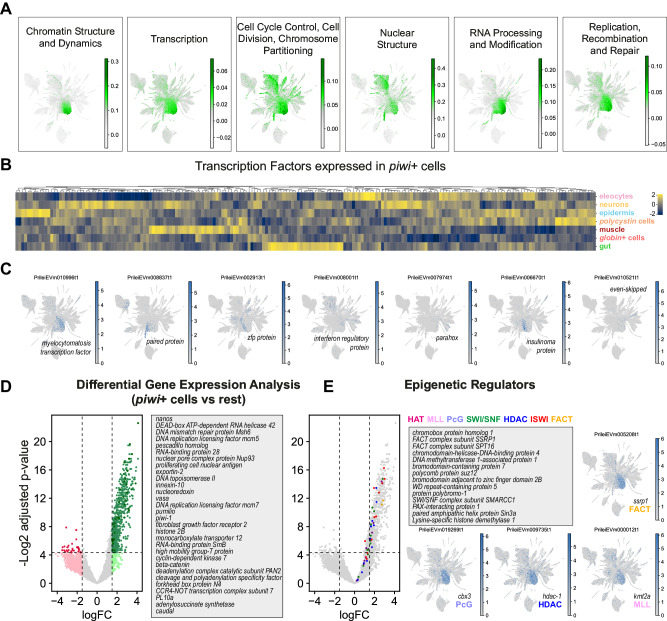
Fig. 8. Transcriptomic profile of annelid piwi+ cells.
A UMAP visualisation of scored gene expression of COGs in piwi+ cells. B Expression heatmap of 200 top TFs expressed in piwi+ cells and their expression in the main broad cell types, showing several clusters of TFs expressed in both piwi+ cells and one or more broad types. C Expression plots of example TFs coexpressed in piwi+ cells and other broad types. D Limma differential gene expression analysis of piwi+ cells (clusters 1, 2 and 8) against all other cell types (bayesian t-statistics from the eBayes limma function, two-sided; adjusted p-values with Benjamini-Hochberg correction). Green colour indicates upregulated genes, red colour indicates downregulated genes. Light colour shade indicates above threshold of logFC, darker colour shade indicates above threshold of logFC and significant (adjusted p-value < 0.05). Examples listed are coloured in darker green. E Detail of annotated epigenetic regulators and their expression enriched in piwi+ cells, and example UMAP visualisations of representative epigenetic factors.

