Fig. 4.
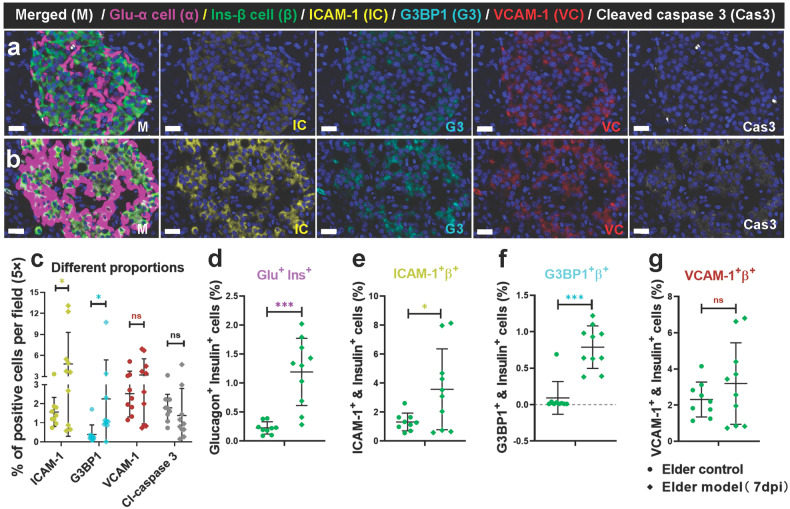
Characteristics of the markers of microvascular damage and cellular stress in elder control and elder COVID-19 model NHPs. a, b The markers of microvascular damage and cellular stress, ICAM-1 and G3BP1, were elevated in the islets of elder COVID-19 model (a) compared with the elder control NHPs (b). Representative multi-labels IF image in the pancreas from the elder control samples were stained for glucagon (α, magenta), insulin (β, green), ICAM-1 (IC, yellow), G3BP1 (G3, cyan), VCAM-1 (VC, red) and Cleaved caspase 3 (Cas3, white). Scale bars, 20 μm. c–g Quantification of the percentage of ICAM-1+ cell, G3BP1+ cell, VCAM-1+ cell, and cleaved caspase 3+ cell, as well as glucagon+insulin+ cell, ICAM-1+insulin+ cell, G3BP1+insulin+ cell and VCAM-1+insulin+ cell in the elder control NHPs (3 slides) and elder COVID-19 model NHPs (4 slides), (n=10 images examined from all sildes/group). Data are presented as mean ± SD. p values were calculated by unpaired two-tailed Student’s t test. *p < 0.05 and ***p < 0.001

