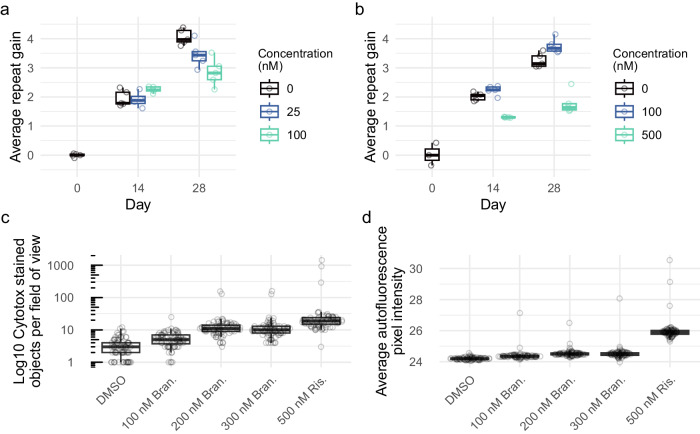
Fig. 5. Branaplam and risdiplam treatments reduced repeat expansion in RPE1-AAVS1-CAG115 cells.
Average repeat gain of non-induced RPE1-AAVS1-CAG115 cells with treatment of either branaplam (a) or risdiplam (b), with the color indicating the drug concentration. Each treatment group and timepoint had five cultures analyzed, except risdiplam day 0 which had three. c Drug cytotoxicity quantified by high-throughput image analysis of cells treated with DNA labeling of dead cells. d Average background autofluorescence pixel intensity. For c and d, 81 images were analyzed per treatment. Box plots show the 25th and 75th percentiles (box), median (horizontal line), and range (whiskers, which are capped at 1.5x the inter-quartile range). Source data are provided as a Source Data file.

