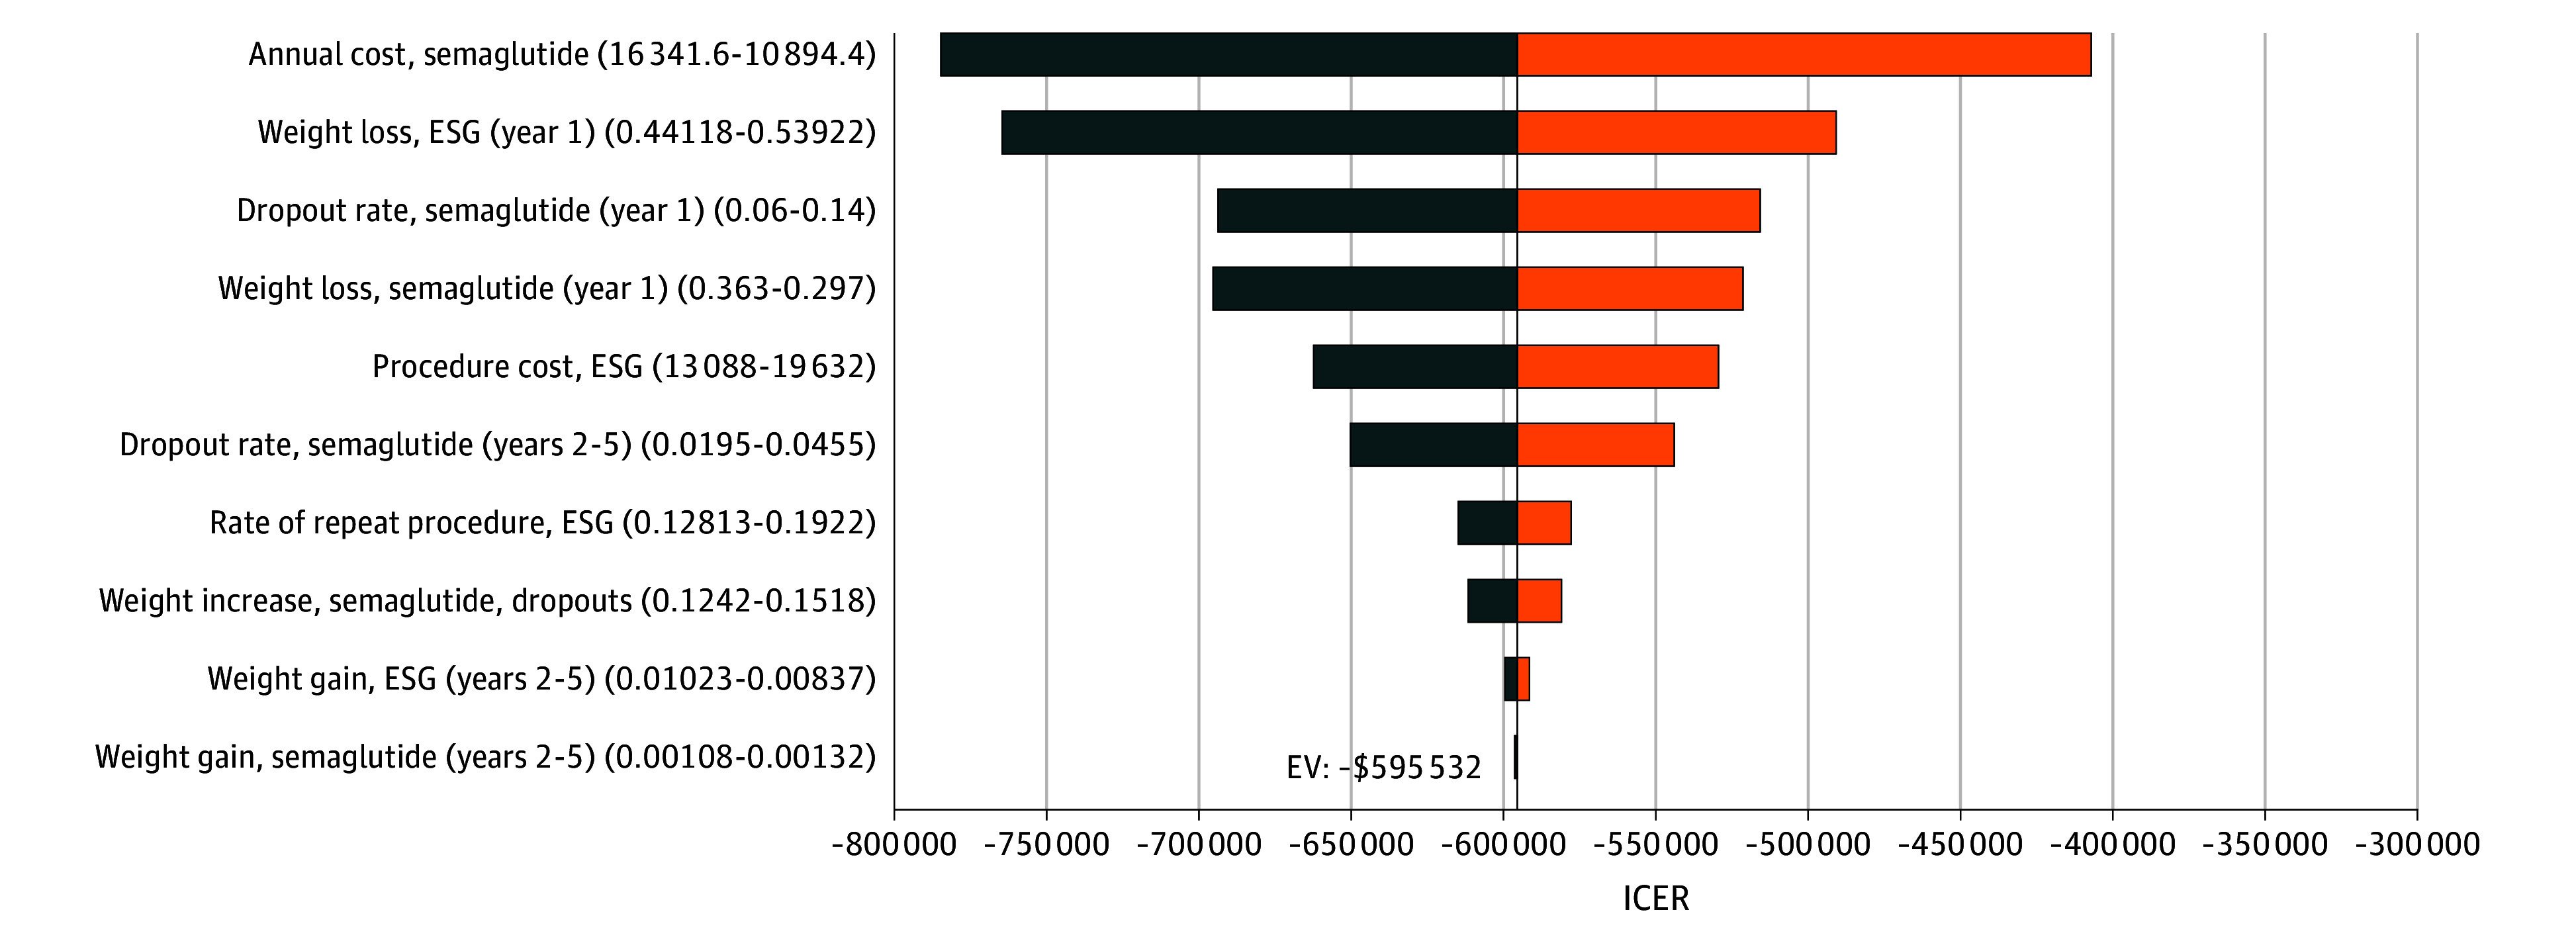
Figure 1. Results of 1-Way Sensitivity Analyses Performed Over a 5-Year Time Horizon.

One-way sensitivity analysis involves adjusting the value of 1 model parameter at a time to assess the association with study outcomes. This figure includes the 10 parameters with the largest association with incremental cost-effectiveness ratio (ICER) values when modified. The numbers on either side of the bars indicate the extreme parameter values associated with the resulting ICER shown in the figure. This figure is centered around the base case with an ICER of –$595 532 per quality-adjusted life-year. ESG indicates endoscopic sleeve gastroplasty; EV, expected value.
