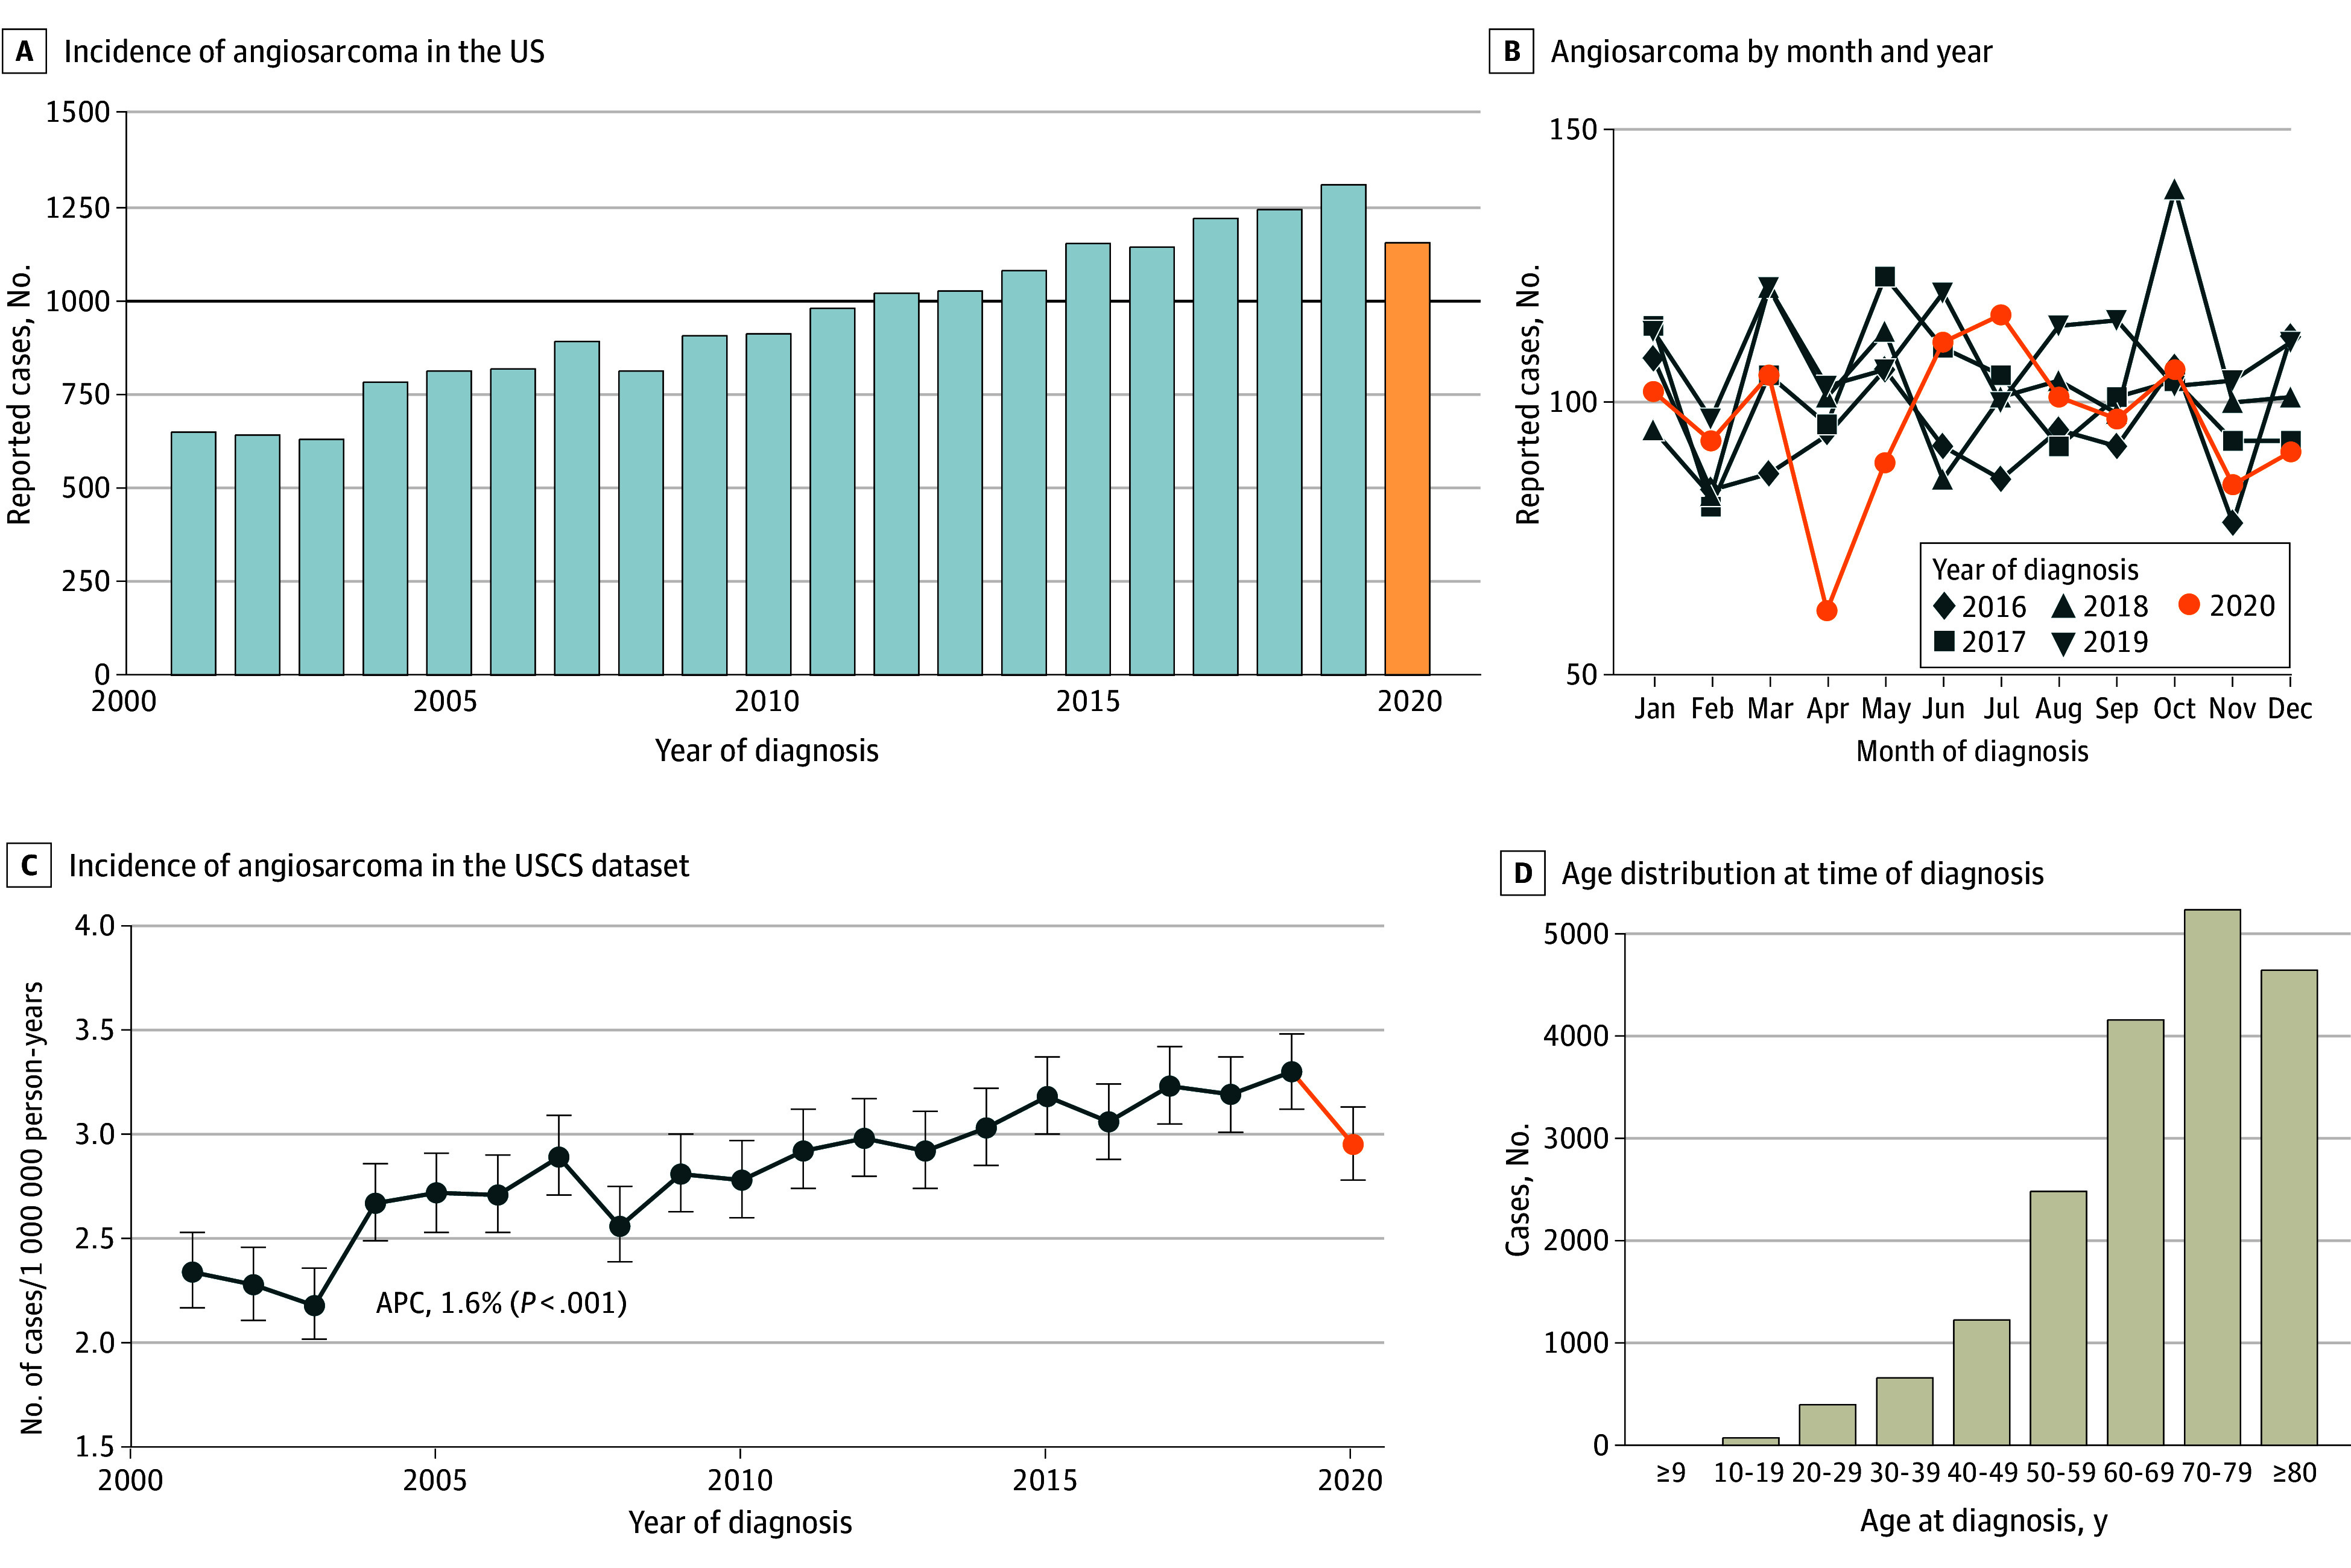
Figure 1. Incidence of Angiosarcoma in the United States (N = 19 289).

A, Cases per year of incident (newly diagnosed) angiosarcoma in the US; the black horizontal line indicates 1000 newly diagnosed cases per year, and the orange bar indicates year 2020, when reported incidence was impacted by COVID-19 pandemic. B, Reported cases of angiosarcoma by month and year, 2016-2020. C, Incidence rate of angiosarcoma in the US Cancer Statistics (USCS) dataset, adjusted for population age and sex. Error bars indicate 95% CIs. D, Age distribution at time of diagnosis. APC indicates annual percentage change.
