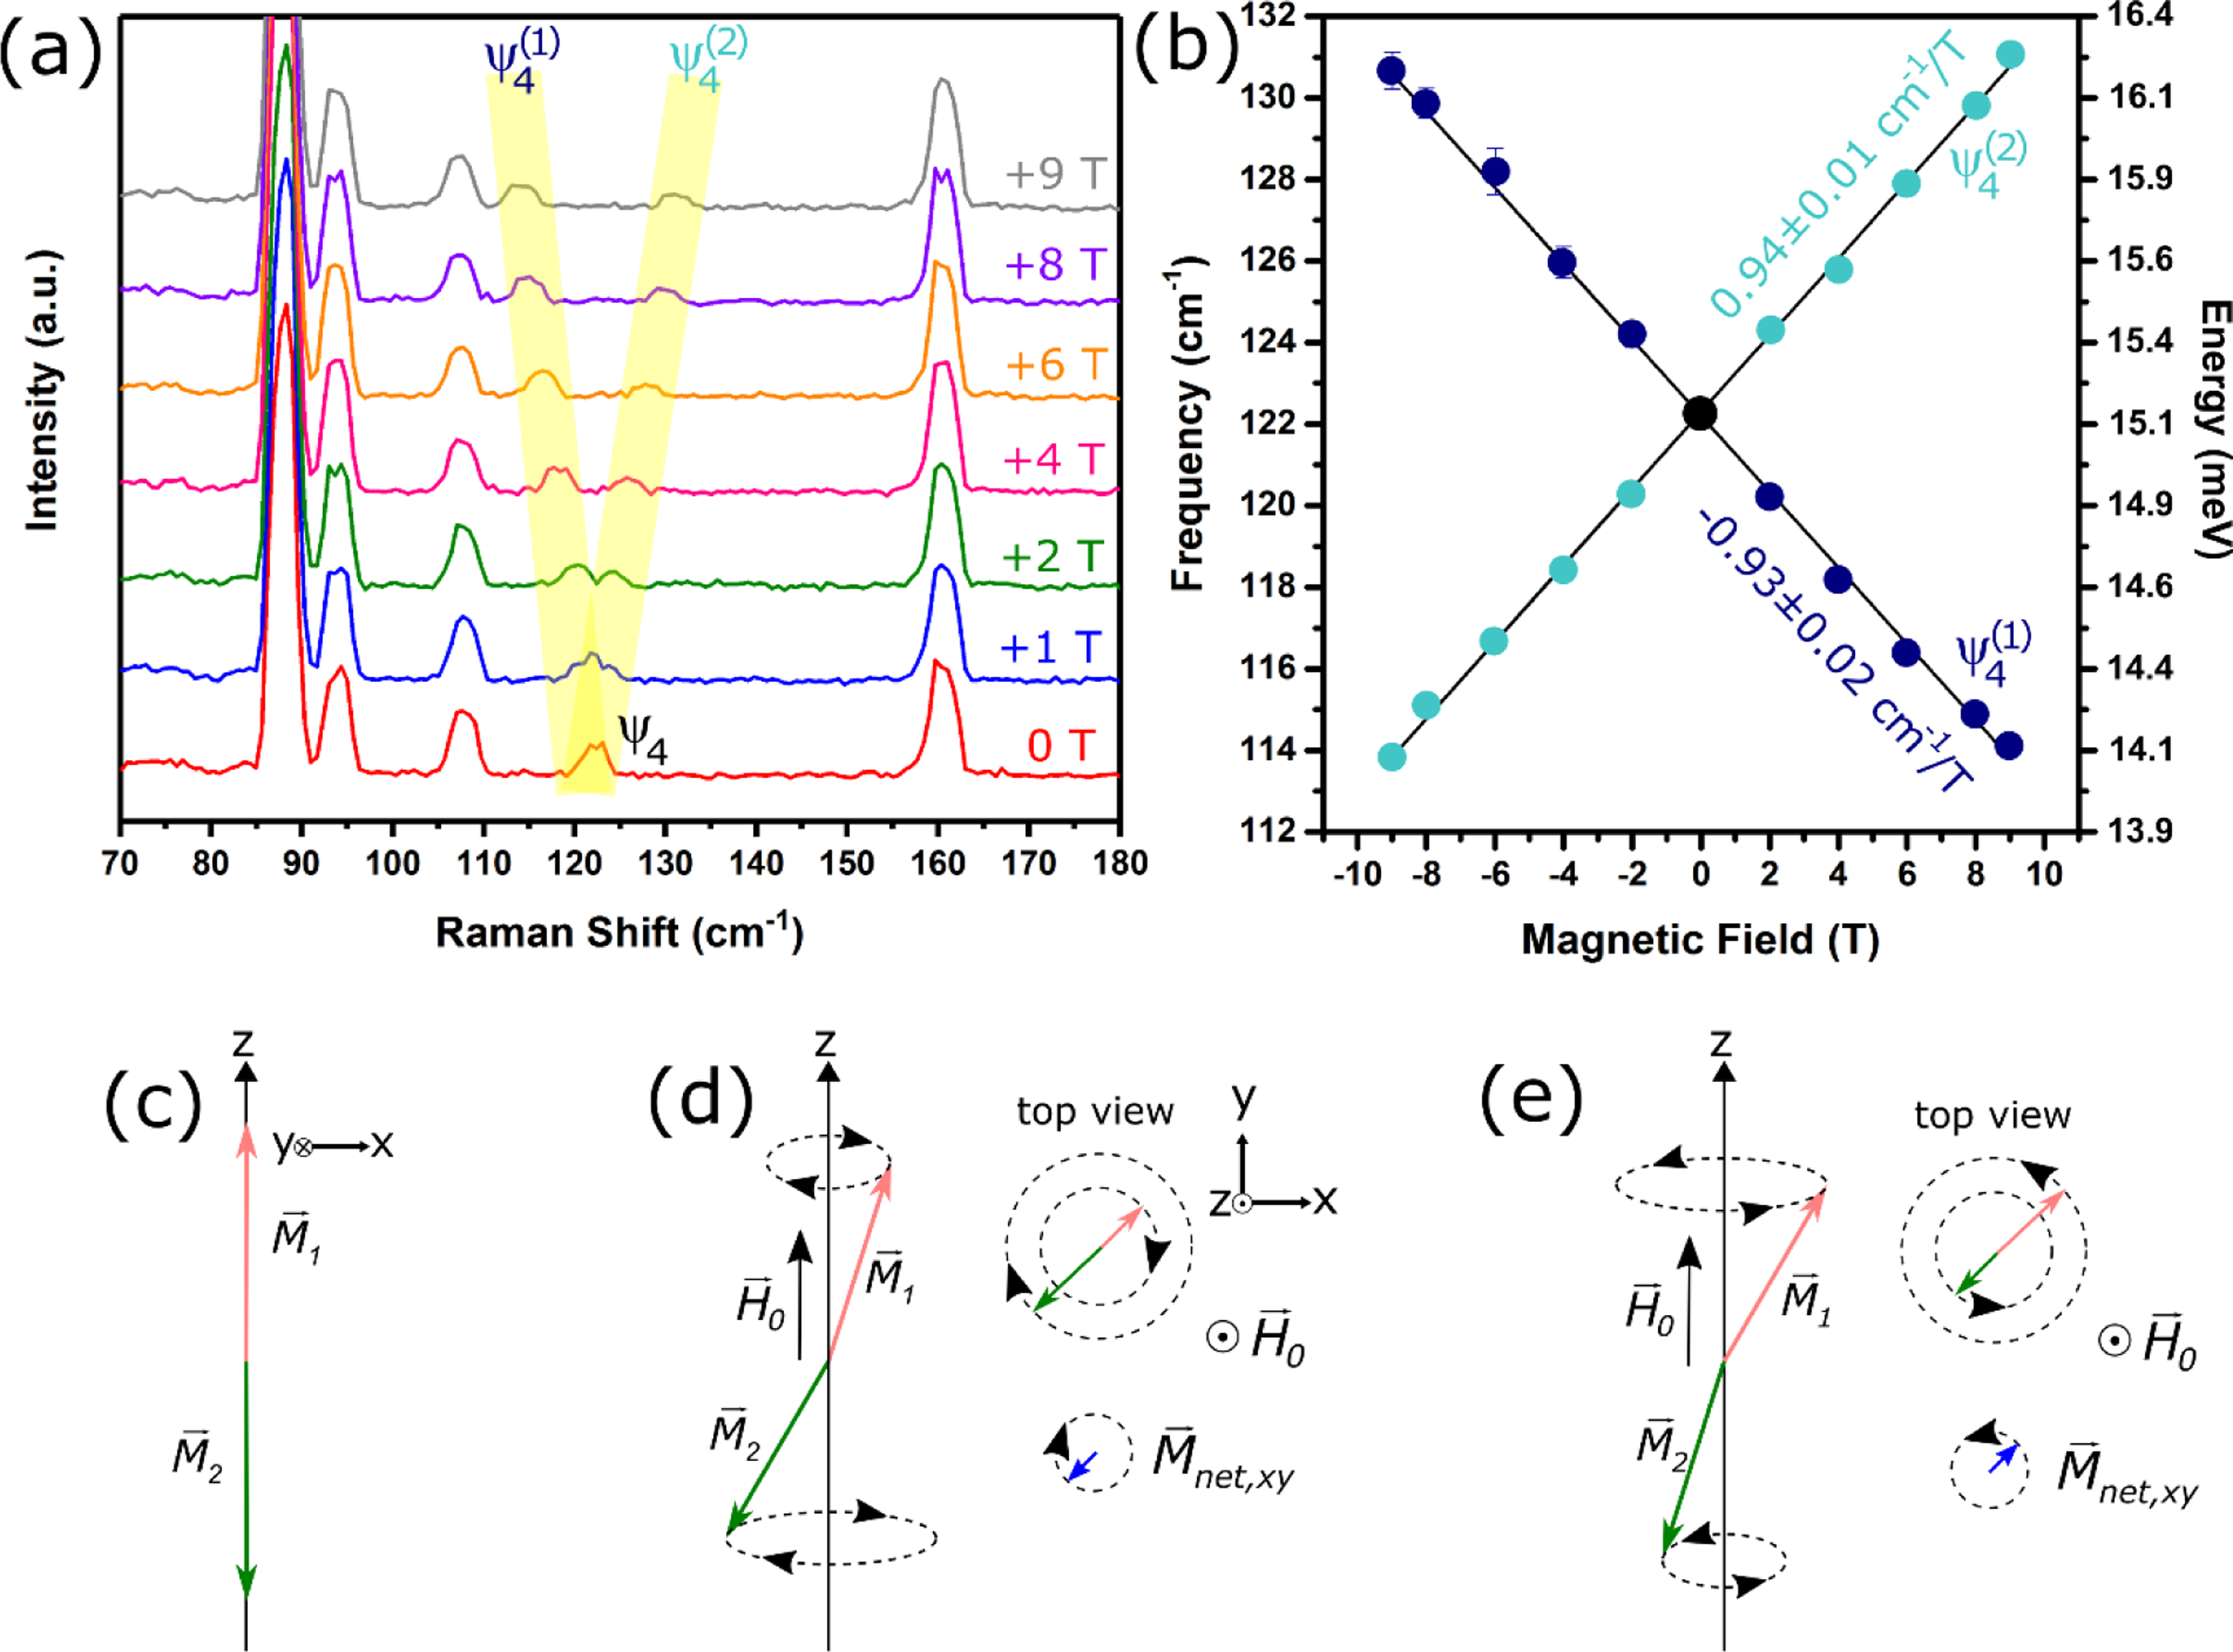
Figure 3.

(a) Magnetic-field dependent Raman of FePS3 at , showing the splitting of into two components, and , where the frequency of () decreases (increases) with increasing magnetic field. (b) Frequency vs. magnetic field of and with the slopes of the linear fits for the two branches. (c) If we consider two magnetization sublattices (pink) and (green) in FePS3, in the ground state and point in the and directions. (d, e) The magnon spectrum includes two normal modes with net moments Mnet in the plane that precess in opposite directions. The degeneracy of these modes is broken in an applied field with the energies of the modes in (d) and (e) respectively decreasing and increasing with . In terms of this simple model, the modes in (d) and (e) would represent and in (b), respectively.
