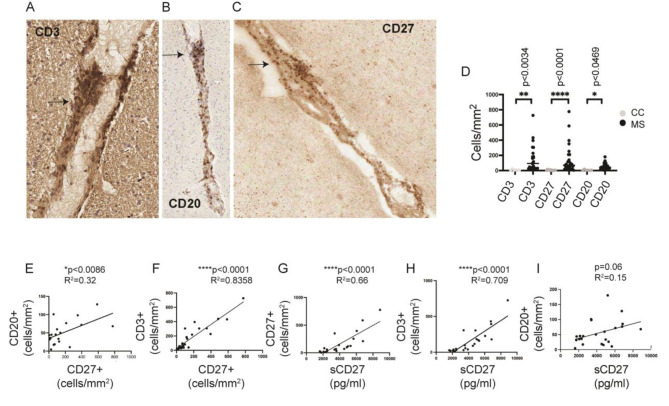
Fig. 5.
Levels of CSF sCD27 were significantly correlated to CD3 and CD27 cell density in matched post-mortem brain tissues of patients with SP-MS. Representation of immunohistochemistry staining of CD3+(A), CD20+ (B) and CD27+ (C) in perivascular cuffs on sections of snap-frozen post-mortem brain tissues from patients with MS. The arrows indicate the positive cells for CD3, CD20 and CD27. (D) Scatter plot reporting the cell density of CD3, CD27 and CD20 cells detected in the perivascular cuffs and meninges in 6 control (grey dots) and 27 MS cases (black dots). Data represent mean ± SD of 6 control cases, 24 MS cases for aCD3, 27 MS cases for CD27, and 23 MS cases for CD20. Statistical analyses were performed by using one-way ANOVA, Kruskal Wallis test with Dunn’s multiple comparison test. *p < 0.05, **p < 0.01, ***p < 0.001. Simple linear regression between CD27 cell density and CD20 cell density (E), and between CD27 cell density and CD3 cell density (F) detected in perivascular cuffs and meninges. P and r2 squared are shown in the legends. Simple linear correlation between levels of CSF sCD27 (pg/ml) and CD27 cell density (G), CD3 cell density (H) and CD20 cell density (I). P and r2 are reported in the plot’s legends

