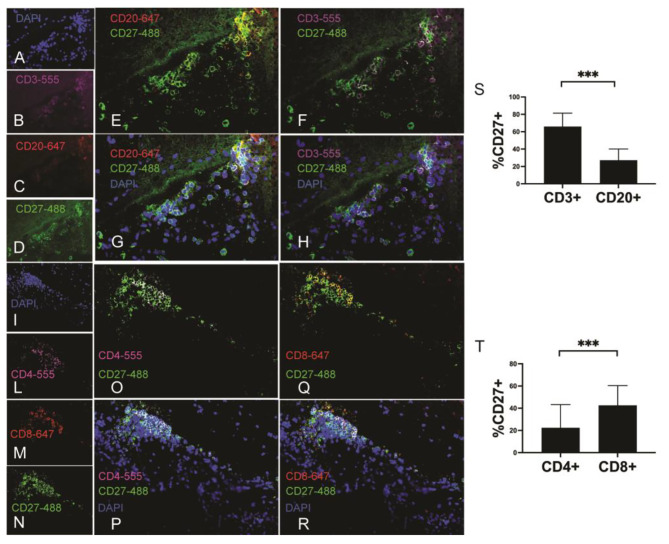
Fig. 6.
CD27 expression on T cells in CNS from MS brain. Representation of immunofluorescence on sections of snap-frozen post-mortem brain tissue performed with 4 colour staining. Single labelling DAPI (A, blue), aCD3 Alexa Fluor 555 (B, purple), CD20 Alexa Fluor 647 (C, red) and CD27 Alexa Fluor 488 (D, green). Colocalization of CD27 on CD20 B cells (E-G) and CD3 T cells (F-H). Single staining DAPI (I, blue), CD4 Alexa fluor 555 (L, purple), CD8 Alexa fluor 647 (M, red) and CD27Alexa fluor 488 (N, green). Colocalization of CD27 on CD4 T cells (O-P) and CD8 T (Q-R). (S) histograms report the percentage of CD27 + cells on CD3 and CD20 cells and (T) on CD4 and CD8 T cells detected in perivascular cuffs and meninges. Data represent mean ± SD. Statistical analysis was performed by using the Mann-Whitney test. ***p < 0.001

