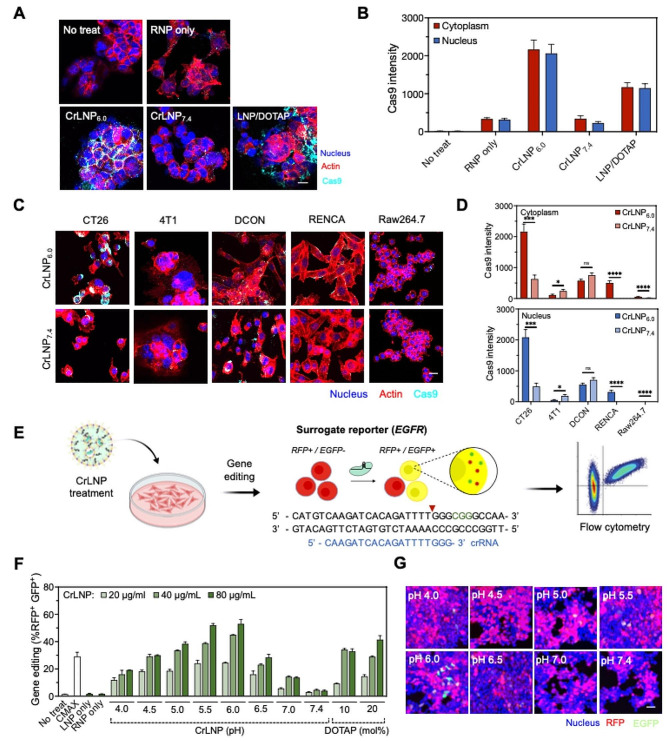
Fig. 3.
Effect of pH on the uptake and gene editing efficiency of CrLNPs. Confocal microscopy of A, B HEK293T cells and C, D various cell lines (CT26, 4T1, DCON, RENCA, Raw264.7) treated with CrLNPs to examine cellular uptake (scale bar: 10 μm for A, 40 μm for C). B, D Quantification of fluorescence by image analyses. Data are shown as mean ± SD, *P < 0.05, ***P < 0.001, ****P < 0.0001 by student’s t-test. E Schematic of CrLNPs treatment to HEK293T cells expressing surrogate reporter and analyses by flow cytometry. Gene editing efficiencies of HEK293T determined by F flow cytometry and G confocal microscopy. Scale bar, 40 μm

